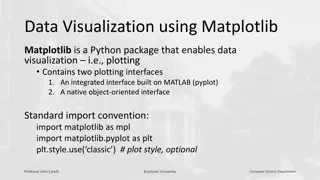
Data Visualization with Matplotlib in Python
Matplotlib is a powerful Python package for data visualization, offering both an integrated interface (pyplot) and a native object-oriented interface. This tool enables users to create various types of plots and gives control over the visualization process. Learn about basic operations, differences
7 views • 19 slides

DCU Power BI 101 Guide for End Users: Interactive Data Visualization Software
Learn about Power BI, an interactive data visualization software by Microsoft, focusing on business intelligence. The guide covers getting started, differences between Service and Desktop versions, and troubleshooting tips. Explore downloading reports, visuals, and summary data, enhancing your data
1 views • 13 slides
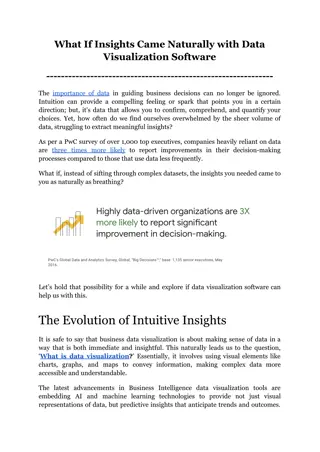
What If Insights Came Naturally with Data Visualization Software
In an era where data is as vital as currency, the power to swiftly unlock and act on its hidden insights could be the key to unlocking unprecedented growth and innovation. Imagine a world where data visualization software not only presents data but intuitively guides you to the insights buried withi
1 views • 6 slides

Evolution of HEC-SSP Analytical Tools and Software Development Team
HEC-SSP, a software developed by the US Army Corps of Engineers, has evolved over the years to meet the statistical needs of the Corps. From its inception in FY2005 to the latest version, the software has seen significant enhancements in capabilities such as General Frequency, Curve Combination anal
9 views • 52 slides
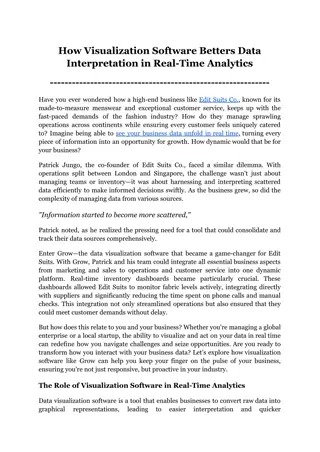
How Visualization Software Betters Data Interpretation in Real-Time Analytics
Join us to learn how you can leverage these powerful dashboard visualization tools to not just see data, but to understand and act on it with unprecedented speed and efficiency.
7 views • 6 slides

Open Source Chat Based Data Visualization With Helical Insight
Open Source Chat Based Data Visualization plays a pivotal role in modern business operations, enabling organizations to derive insights, make informed decisions, and drive growth. However, traditional visualization tools often come with high costs and steep learning curves, limiting accessibility an
1 views • 2 slides
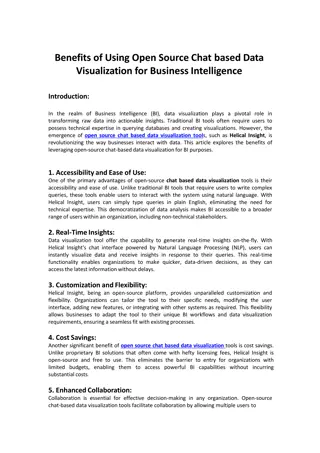
Benefits of Open Source Chat-based Data Visualization
In the realm of Business Intelligence (BI), data visualization plays a pivotal role in transforming raw data into actionable insights. Traditional BI tools often require users to possess technical expertise in querying databases and creating visualizations. However, the emergence of open source chat
1 views • 2 slides
Open Source Alternative to Tableau for Data Visualization in 2024
As businesses increasingly rely on data-driven decisions, the demand for powerful data visualization tools continues to grow. Tableau has long been a leader in this space, known for its robust capabilities and user-friendly interface. However, open-source alternatives are gaining traction due to the
0 views • 2 slides
Software Engineering: Concepts and Characteristics
Software engineering involves the application of scientific principles and methods to develop efficient, reliable software products. The need for software engineering arises due to factors like large software size, scalability, cost concerns, dynamic nature, and quality management. Good software exh
4 views • 25 slides

Reusing Phylogenetic Data for Enhanced Visualization and Analysis
Reusing phylogenetic data can revolutionize scientific research by enabling synthesis of knowledge and comparative analyses across scientific disciplines. However, a significant portion of valuable phylogenetic data is lost due to the prevalent use of static images for tree publication. To address t
0 views • 8 slides

Wind Tunnels: Devices for Aerodynamic Testing
Wind tunnels are devices that simulate air flows to test models under controlled conditions. They are classified as low-speed and high-speed tunnels, used to replicate flying or moving objects. Testing involves studying air motion using techniques like smoke visualization, colored threads, and speci
2 views • 37 slides
Software Processes and Models
This lecture discusses software processes, models, and activities involved in requirements engineering, software development, testing, and evolution. It covers topics such as process models, computer-aided software engineering (CASE) technology, software specification, design, validation, and evolut
2 views • 25 slides

Bibitor LLC Inventory Analysis Case Study Phase 3
This case study by Bibitor LLC involves analyzing data related to the liquor store chain's wine and spirits business. Students will gain insight into data analytics, visualization, and statistical analysis to make informed business decisions. The case is presented in phases, focusing on data prepara
1 views • 21 slides

Interactive Plotting with ggplot and Shiny: Enhancing Galaxy Visualization Tools
Explore the concept of transforming existing ggplot2 Galaxy tools into interactive platforms using Shiny or Plotly implementations. Discover a variety of plot types available with ggplot2, such as barplots, violin plots, PCA plots, and heatmaps. Utilize additional plot options through various geom_*
3 views • 9 slides
Software Measurement and Metrics in Software Engineering
Software measurement plays a crucial role in assessing the size, quantity, and quality of software products and processes. It involves direct and indirect measurement methods to monitor and improve software quality, predict future outcomes, and manage project budgets and schedules. Software metrics
0 views • 8 slides

EEG Conformer: Convolutional Transformer for EEG Decoding and Visualization
This study introduces the EEG Conformer, a Convolutional Transformer model designed for EEG decoding and visualization. The research presents a cutting-edge approach in neural systems and rehabilitation engineering, offering advancements in EEG analysis techniques. By combining convolutional neural
1 views • 6 slides
Software Cost Estimation in Software Engineering
Software cost estimation in software engineering involves predicting the resources required for a software development process. It includes fundamental estimation questions, software cost components, costing and pricing considerations, software pricing factors, and programmer productivity assessment
0 views • 30 slides

ATST Safety Review High-Level Software Overview
This document provides an overview of the high-level software components involved in the ATST Safety Review conducted on 26th January 2011. It includes details on the Telescope Software Control Systems, Observatory Software Control Systems, and Instrument Software Control Systems, along with respons
13 views • 15 slides

Design and Evaluation in Visualization Techniques
Understanding the importance of formal evaluations in visualization techniques, this material covers a range of evaluation methods including empirical and analytic approaches such as usability tests, controlled experiments, and expert reviews. It delves into the scientific method of hypothesis forma
1 views • 41 slides
Software Engineering: An Overview by Lecturer Sebastian Coope
Explore the world of software engineering with Lecturer Sebastian Coope in this informative module introduction. Discover the importance of structured and disciplined approaches in making software, the challenges in software development, and the necessity of software engineering in handling complex
5 views • 37 slides
Multidimensional Icons in Data Visualization Solutions
This collection showcases various types of visual icons used in data visualization to represent values of different variables, such as categorical, quantitative, and Boolean data. Each icon summarizes specific information for a given item in a collection, ranging from nominal and ordinal data to the
0 views • 9 slides

Enhancing Safety in Navigation Through Improved Data Quality Visualization
The IHO Data Quality Working Group focuses on classifying and depicting the quality of digital hydrographic information to ensure safe navigation. The group addresses the need for clear warnings on ECDIS displays regarding poor-quality survey data. Despite progress in developing visualization method
1 views • 34 slides

Software Design Patterns for Information Visualization
Explore design patterns for information visualization interfaces, understand the complexities, and leverage tools like Google API. Learn about different software design patterns, categories of patterns for information visualization, and the relationships between them. Discover the reference model fo
0 views • 27 slides
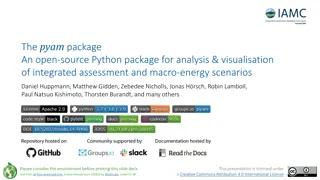
Overview of the pyam Package for Integrated Assessment and Macro-Energy Scenarios
The pyam package is an open-source Python tool for analysis and visualization of integrated assessment and macro-energy scenarios. Developed by a team of contributors, it provides a workflow from model to insight, supporting various data models and file formats. With features for data processing, va
0 views • 5 slides
Insights from NATO Software Engineering Conferences and The Software Crisis of the Seventies
Exploring the challenges faced in software engineering during the 1970s, including issues such as project delays, inefficiencies, and the critical need for reliable, high-quality software. Insights from the NATO Software Engineering Conferences shed light on the struggle to meet increasing modern so
0 views • 46 slides

Interactive Data Visualization Tools and Techniques Quiz
This quiz tests knowledge on data visualization tools, techniques, and concepts. Questions cover topics such as the use of EDA in data visualization, interactive graph outputs, historical figures in data visualization, GIS data types in SAS/JMP, outlier detection in 3D scatterplots, and limitations
1 views • 11 slides
Cognition Models in InfoVis: Understanding Knowledge Creation Process
Visualization plays a key role in aiding cognition by supporting knowledge creation and seeking tasks through process models and task taxonomies. Understanding the cognitive aspects of information visualization is crucial for aiding comprehension and knowledge understanding, as demonstrated by the u
0 views • 41 slides
Enhancing Classmate's Data Visualization for Homework Assignment 2
Explore the process of applying a classmate's data visualization code to your own data for Homework Assignment 2. Critique the effectiveness of the visualization in conveying the intended point and offer suggestions for improvement if necessary. Follow the steps outlined to submit your completed ass
0 views • 4 slides
A Comprehensive Guide to Tableau Data Visualization
Tableau is a user-friendly business intelligence software that enables users to connect to various data sources and create interactive dashboards easily. Tableau Desktop offers powerful visualization tools and supports connections to different data systems. The software provides a range of graphic t
0 views • 15 slides
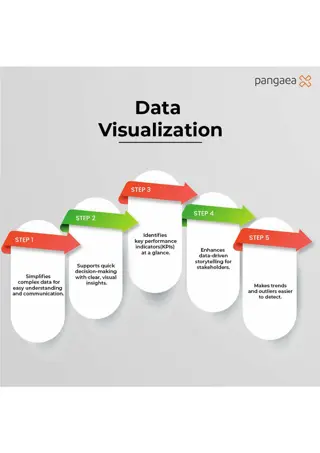
Maximize Business Impact with Data Visualization
This infographic shows how data visualization simplifies complex data, supports decision-making, highlights KPIs, and enhances data-driven storytelling. Its an essential tool for identifying trends and outliers. Discover expert data visualization talent at Pangaea X by visiting www.pangaeax.com.
7 views • 1 slides

Data Visualization Presentations Collection
Collection of various image slides containing charts, graphs, and data visualization elements. The slides showcase different types of visual representations such as bar graphs, line charts, percentages, and more. Each slide provides a unique visualization, making it a diverse collection for presenta
0 views • 13 slides

Software Bingo_ A Game-Changing Addition to Your Online Casino
Discover how software bingo, bingo game software, professional bingo software, software for bingo, pc bingo games software can enhance your online casino and boost player engagement.\n\nSource>>\/\/ \/bingo-software\n\n
1 views • 4 slides
The Essence of Software Development Process
Software is a vital component in today's technology-driven world. It consists of instructions, data structures, and descriptive information that enable the functioning of computer programs. Unlike hardware manufacturing, software development is an engineering process that undergoes changes and deter
0 views • 74 slides
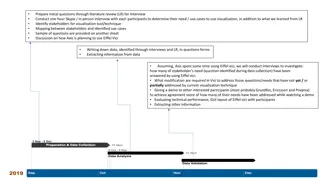
Effective Stakeholder Interviews for Visualization Tool Improvement
Conducting in-depth interviews with stakeholders is crucial for identifying their needs and use cases for visualization tools. By asking targeted questions and analyzing responses, insights can be gained to enhance the current visualization technique, like Eiffel Vici. The process involves mapping s
0 views • 5 slides

Software Engineering Fundamentals
Explore the significance of software in modern economies, the attributes of good software, software engineering principles, software processes, and process models. Learn how software engineers ensure functionality, maintainability, dependability, efficiency, and usability in software development.
0 views • 25 slides

Software Engineering and Development Processes
Explore the key concepts of software engineering, including misconceptions, legacy software, and development phases. Learn about professional responsibilities, the need for software processes, the ETVX model, and different properties of software processes. Discover the components of software process
1 views • 57 slides
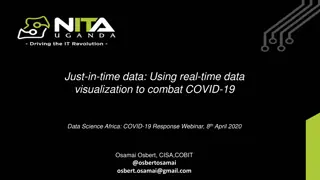
Real-Time Data Visualization for Combatting COVID-19 Challenges
Utilizing just-in-time data and real-time data visualization methods to address key challenges posed by the COVID-19 pandemic, such as identifying high-risk individuals, monitoring quarantines, and combating misinformation. Interventions include data entry tools, chat bots, and integration of variou
1 views • 11 slides

Enhancing Data Visualization Community Engagement through Viz and Tell Sessions
This resource outlines a model for building a critical community focused on data visualization, offering Viz and Tell/Coffee Break sessions to encourage engagement and learning. Topics covered include visualization instruction, tools, ethics, data journalism, and more. The model emphasizes open disc
0 views • 6 slides
Importance of Data Visualization in Network Management
Data visualization plays a crucial role in understanding and extracting value from data, especially in the realm of network management. Visualization techniques enable better decision-making, pattern recognition, and storytelling with data. By exploring data through visualization tools, one can unco
0 views • 26 slides
Top 5 Open Source Data Visualization Tools
This blog explores the top 5 open source data visualization tools that are transforming the way we interpret data. Whether you're a data analyst, developer, or business professional, these tools can help you unlock the power of data visualization.
0 views • 5 slides