Normal Distribution in Statistics Education
Lesson resources for teachers to teach students about analyzing and understanding normal distribution in statistics. Includes learning standards, agenda, presentation, vocabulary activities, and additional resources. Emphasizes using mean and standard deviation to fit data to a normal distribution,
10 views • 23 slides

Normal Conditions of Use for New Propulsion Technologies in Vehicles
Explore the concept of normal conditions of use for vehicles with new propulsion/charging technologies. Learn how to assess and define normal conditions, operating modes, worst case scenarios, and overview of current technologies. Discover the approach to measure normal conditions and testing requir
2 views • 8 slides

Normal Flora of Human Body
Normal flora, comprising bacteria and fungi, are beneficial residents of specific body sites like the skin, colon, and vagina. These organisms, known as commensals, play a vital role in maintaining a healthy microbial balance. The internal organs are usually sterile, while different types of normal
2 views • 16 slides
Bivariate Normal Data Analysis: LPGA 2008 Season Overview
Explore the analysis of bivariate normal data focusing on LPGA driving distance and fairway percent from the 2008 season. Learn how to compute confidence ellipses, estimated means, variance-covariance matrix, eigenvalues, eigenvectors, and plot insightful visualizations. Understand the method, set u
1 views • 8 slides
“Quantitative Data Analysis for Development - NEC Conference 2019 Overview”
Explore the key modules of the National Evaluation Capacities Conference 2019 focusing on quantitative data analysis for development. Covering topics such as basic concepts, summary statistics, bivariate analysis, hypothesis testing, data visualization, and the effective use of dummy tables in evalu
0 views • 25 slides
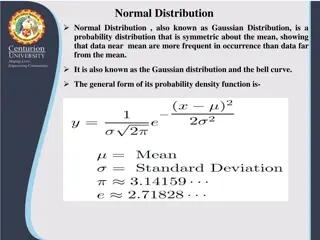
Normal Distribution and Its Business Applications
Normal distribution, also known as Gaussian distribution, is a symmetric probability distribution where data near the mean are more common. It is crucial in statistics as it fits various natural phenomena. This distribution is symmetric around the mean, with equal mean, median, and mode, and denser
2 views • 8 slides
The Standard Normal Distribution in Statistics
Exploring the significance of normal distributions in statistics, this lesson covers the 68-95-99.7 rule, using Table A to find probabilities and z-scores, properties of normal curves, and the standard normal distribution. Key concepts include the mean, standard deviation, and how to standardize var
5 views • 9 slides
Normal Distribution Calculations in Statistics
Exploring normal distribution calculations in Statistics involves calculating probabilities within intervals and finding values corresponding to given probabilities. This lesson delves into the application of normal distribution to determine probabilities of scoring below a certain level on tests an
3 views • 13 slides
Normal Distribution in Probability
Explore the properties and characteristics of the normal distribution, including the mode, symmetry, inflection points, and the standard normal distribution. Learn how to use standard normal tables to find probabilities and areas under the curve. Practice using examples to calculate probabilities ba
1 views • 35 slides
Outlier Analysis in Data Mining
Outliers are data objects that deviate significantly from normal data, providing valuable insights in various applications like fraud detection and customer segmentation. Types of outliers include global, contextual, and collective outliers, each serving distinct purposes in anomaly detection. Chall
0 views • 44 slides

Managing Normal.dotm in Microsoft Word
Learn about Normal.dotm in Microsoft Word, the default template for new documents. Find out how to locate, create, modify, and deal with corrupted Normal.dotm files. Explore the importance of Normal.dotm in customizing your Word documents efficiently.
0 views • 19 slides
The Normal Probability Curve
The Normal Probability Curve, also known as the normal distribution, is a fundamental concept in statistics. It is symmetric around the mean, with key characteristics such as equal numbers of cases above and below the mean, and the mean, median, and mode coinciding. The curve's height decreases grad
1 views • 10 slides
Normal and Abnormal Behavior: Perspectives and Definitions
Normal behavior varies from person to person and society, influenced by individual preferences and societal norms. Abnormal behavior is characterized by an inability to function effectively or personal discomfort. The concept of normality and abnormality in psychology raises complex questions about
3 views • 8 slides
Statistical Application in FRSC Operations
In the study of central tendency and variability measures, bivariate data comes into play when relating pairs of measurements involving two variables. This lecture delves into the coefficient of correlation, which quantifies relationships between random variables. The aim is to familiarize participa
2 views • 14 slides
Normal Forms in Propositional Logic
Explore the concept of normal forms in propositional logic, where each formula has a unique truth-value function. Learn about equivalence of formulas, determining normal forms, and canonic forms like Disjunctive Normal Form (DNF) and Conjunctive Normal Form (CNF). Discover how to find canonic forms
2 views • 22 slides

Normal Parturition: The Stages and Processes
Normal parturition, also known as childbirth, involves several stages including uterine contractions, cervix dilatation, fetal positioning, and the weakening of the placental connection. The process gradually prepares the birth canal for delivery, with the fetus assuming a specific position for birt
1 views • 19 slides
Landslide Susceptibility Using Frequency-Ratio Method
This informative content delves into the Frequency-Ratio Method for Landslide Susceptibility Index (LSI), supported by the National Science Foundation. It explains how Frequency-Ratio (FR) methods are used for analyzing landslide susceptibility, the mathematical calculations involved in determining
0 views • 15 slides
Comprehensive Guide to the Management of Normal Labor by Professor Muhsin-AL-Sabbak
Understanding the management of normal labor is crucial for healthcare professionals. This comprehensive guide covers the definition of normal vaginal delivery, diagnosis of labor, stages of labor, phases of labor, and the use of tools like partogram and cardiotocography to monitor progress. Profess
0 views • 9 slides

Normal Labour in Pregnancy
Labour is the natural process of expelling a mature foetus from the uterus. Criteria for normal labour include spontaneous expulsion of a single, mature foetus within a reasonable time frame without complications. Various theories explain the onset of labour, such as hormonal factors and mechanical
0 views • 35 slides
Different Types of Data in Statistics
Explore various types of data in statistics including discrete, categorical, bivariate, ordinal, and continuous data. Learn how to distinguish between these data types through examples and understand how they are used for data collection and analysis in different scenarios.
0 views • 8 slides
Bivariate Data Analysis: Trends and Predictions
Explore bivariate data analysis, scatter plots, linear regression, correlation coefficients, and trend predictions. Learn how to interpret patterns, fit regression equations, and make predictions based on data. Discover the relationship between variables in real-life scenarios through examples and k
0 views • 17 slides
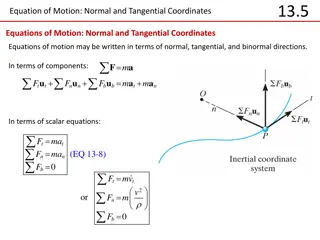
Equations of Motion in Normal and Tangential Coordinates
Equations of motion can be expressed in terms of normal, tangential, and binormal directions. The normal and tangential components play crucial roles in describing the motion of an object. Through scalar equations and component representations, these equations help analyze forces and acceleration in
0 views • 8 slides
Regression Analysis in Data Science
Explore the principles of regression analysis in data science, focusing on bivariate regression and linear models. Learn how to write the equation of a line to describe relationships between variables and assess the goodness of fit using scatterplots, correlation coefficients, determination coeffici
2 views • 29 slides
Displacement, Deformation, and Normal Strain in Mechanics of Materials
Displacement and deformation in materials play a crucial role when loads are applied, leading to normal strain. This lecture discusses the concepts of displacement, deformation, and strain, covering topics such as types of strain, strain units, normal strain calculations, and the orientation of norm
0 views • 7 slides
Linear Regression Diagnostics
The essential conditions for a valid least squares line in linear regression, including linearity, nearly normal residuals, and constant variability. Learn how to assess linearity through scatterplots, evaluate residuals' normality using histograms or Q-Q plots, and understand the anatomy of residua
0 views • 15 slides
Graphical Methods for Data Distributions
In this chapter, Kathy Fritz presents graphical methods for describing data distributions. It covers variables, data types (univariate, bivariate, multivariate), categorical and numerical variables, and their characteristics. Understand the distinctions between different types of data and variables,
0 views • 70 slides
Describing Bivariate Data: Graphical Analysis and Interpretation
Bivariate data analysis involves exploring the relationship between two variables through graphical representations such as comparative bar charts, line charts, and scatterplots. These visualizations help in understanding patterns, strength of relationships, and identifying outliers or clusters in t
0 views • 26 slides

Auckland University Statistics Workshop for Teachers
In November 2019, Neil Marshall organized a Statistics Day Workshop at Auckland University to support teachers new to NCEA in making accurate judgements for statistics Achievement Standards. The workshop focused on Level 1 AS but was relevant for Levels 2 and 3 as well. Resources and guides for seco
0 views • 18 slides

Bivariate Genetic Analysis Practical
Genetic analysis, Twin covariances, Bivariate, Heritability, Variance decomposition
0 views • 15 slides

Normal Curve in Data Analysis
This overview delves into the concept of normal curves and Z-scores in statistics. Explore how to identify unusual data points, calculate Z-scores, determine percentile scores, and analyze the relative position of raw scores in a normally distributed population. Gain insights into interpreting vocab
0 views • 21 slides

Assessing Normality, Dealing with Non-Normal Data, and Handling Missing Data
Explore methods for assessing normality, detecting non-normal data, and managing missing data in research studies. Learn about skewness, kurtosis, outliers, and transformations to address non-normal data effectively. Understand the importance of data logs in recording activities and making necessary
2 views • 24 slides

Understand Continuous Distribution Functions and the Normal Distribution
Learn about continuous distribution functions, the famous normal distribution, examples of phenomena modeled by normal distributions, and the central limit theorem. Explore the implications of truncating predictions in representing data with normal distributions and the usefulness of the half-normal
0 views • 50 slides
Understanding Statistical Relationship in Econometrics
Explore the concept of statistical relationship in econometrics, focusing on characterizing the relationship between variables of interest and related ones. Learn about bivariate distribution, conditional moments, sample data analysis, and the impact of conditioning on reducing variation in economet
1 views • 47 slides
Understanding Normal Distribution and Bell Curve in Statistics
Explore the concept of normal distribution and bell curve through various examples, including analyzing data for different populations and calculating percentages within standard deviations. Learn how to sketch normal curves and analyze data sets efficiently.
0 views • 12 slides

Discrete Choice Modeling: Bivariate & Multivariate Probit Analysis
Explore the application of bivariate and multivariate probit models in discrete choice modeling, with a focus on analyzing health care usage data and understanding the relationship between binary variables through tetrachoric correlation. Learn about model specification, estimation, inference, and m
1 views • 43 slides

Interpreting Data with Two-Way Frequency Tables
Learn how to represent and interpret data using two-way frequency tables, joint frequency, marginal frequency, and conditional relative frequency. Discover the importance of capturing survey information in bivariate tables. Dive into examples and understand the significance of joint and marginal fre
0 views • 17 slides
Analyzing Bivariate Data in Excel for Correlation and Regression
Learn how to calculate correlation coefficients and perform simple linear regression in Excel using Example 4.1 data. Follow step-by-step instructions with screenshots to summarize bivariate data effectively.
0 views • 13 slides
Understanding Data Sampling and Surveys for Statistical Analysis
Learn about qualitative and quantitative data, univariate and bivariate datasets, types of sampling methods, and evaluating sample validity in statistical studies. Explore examples and methods for effective data collection and analysis in surveys.
0 views • 11 slides
Statistical Decision Making with Bivariate Data in Excel
Learn how to perform statistical decision making with bivariate data using Excel. This includes conducting contingency tests, hypothesis tests for regression model coefficients, and interpreting the results for informed decision-making. Follow step-by-step instructions and utilize tools like CHISQ.T
0 views • 13 slides
Understanding Mental Health Nursing Concepts of Normal and Abnormal Behavior
Explore the fundamentals of mental health nursing as presented by Sr. Dhanya, an Associate Professor. Delve into defining normal and abnormal behavior, factors influencing behavior, traits of individuals with normal and abnormal behavior, and psychoanalytic models. Gain insights into the continuum o
0 views • 20 slides