Utilizing Remote Sensing and Field Surveys for Environmental Data Collection

Explore the comprehensive approach to obtaining data for spatial and temporal characteristics of plants, animals, weather, geology, and more. Learn about the data needed, sources available, considerations in data collection methods, and ensuring accuracy and precision. Jim Graham from Humboldt State University provides insights into the importance of data on plant and animal locations, forests, infrastructure, weather conditions, and geological types. Discover how remotely sensed data from satellites and field surveys play a crucial role in environmental data collection and analysis.

Uploaded on Sep 14, 2024 | 0 Views
Download Presentation

Please find below an Image/Link to download the presentation.
The content on the website is provided AS IS for your information and personal use only. It may not be sold, licensed, or shared on other websites without obtaining consent from the author. Download presentation by click this link. If you encounter any issues during the download, it is possible that the publisher has removed the file from their server.
E N D
Presentation Transcript
GSP 510 Obtaining Data Jim Graham, Humboldt State University
What is the problem youre trying to solve? Where to plant, burn, eradicate, protect Where to put or remove infrastructure: Trails, roads, buildings Leads to spatial/temporal characteristics of: Plants and animals (including people)? Weather Geology Topography Existing infrastructure Pollution, etc. Jim Graham, Humboldt State University
What do you need data on? Plant locations Animal locations Forests, plant extent, infestations Rivers, trails, roads Buildings, airports, power stations Human traffic Weather: temp, humidity, precip, wind, solar radiation Geological type Jim Graham, Humboldt State University
What do you need? Uncertainty: Accuracy, Precision, Gross Errors Data type: Point, Polyline, Polygon, Raster Temporal range: Every 10 minutes? Annually? Location and time (uncertainty?) Measurements? Jim Graham, Humboldt State University
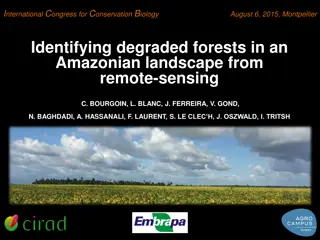
Sources Remotely sensed: Satellite, Aerial, UAV Produces rasters (typically) Field Surveys: GPS, RTK, Maps Produces points, lines, polygons Digitizing: Points, lines, polygons from rasters Other Object recognition, transformations, modeling, etc. Jim Graham, Humboldt State University
Remotely Sensed Satellites: From 250 meters twice a day (MODIS) To 1 meter tasked (Digital Earth) Aerial 1 meter Jim Graham, Humboldt State University
Considerations Visual remote sensing only sees the top surface Radio waves and LiDAR can penetrate canopy GPS (and cell phones), RTK work best with clear view of the sky Maps work everywhere but take time to create and you need the data! Field surveys are expensive We can digitize and, sometimes, automatically convert data types Jim Graham, Humboldt State University
Data Availability There are lots of sources of data Most will not have exactly what you need Find it, QAQC, transform, filter Model? Use UAV? Field surveys? Jim Graham, Humboldt State University
Where to Look The Web, those working in an area that might create or use the data Local folks Global, national, state, and local organizations! Colleagues Anyone that might have it? Jim Graham, Humboldt State University
Topography 30-meter DEMs of the world 10-meter DEMs in US OpenTopography has LiDAR for most of California Converting contour lines to a DEM has very high uncertinaty Jim Graham, Humboldt State University
Weather National Weather Service (NOAA) RAWS fire data Research Stations Angelo reserve PRISM modeled data from OSU There are many private weather stations Jim Graham, Humboldt State University
Geology and Soils SSURGO is national soil data Complex, not sure of accuracy, only 2 meters Geology maps available Only show general geologic formations Soil pits and taking cores is expensive Might be available Jim Graham, Humboldt State University
Field Data Collection Huge variety of field instruments we re just going to focus on the spatial-temporal aspect Cell Phones Applications GPS and/or RTK: with notebook (paper or computer) Typically MS-Excel files Jim Graham, Humboldt State University
Mobile Devices Cell phones and tablets (e.g. iPads) are effectively field computers Available applications: Avanza Maps: access maps on mobile device Survey123: Easy to use, collects points w/attributes Field Maps: Much more complex, has some issues QField: I ve heard good things Custom applications Jim Graham, Humboldt State University
Custom Applications iPhones and iPads are based on iOS Android is the OS for Android devices Developing for these takes dedicated software developers Mobile Devices also support browsers Web sites on devices are popular but not as fast as dedicated apps However, you can create a streamlined, fast, and reliable field data collection system Jim Graham, Humboldt State University
Issues with Data Transforming data typically increases uncertainty Projecting does not convert values in attributes: Area, Length, X, Y, Z Need to use the correct sampling for rasters: Nearest neighbor for categorical values Bilinear or spline for continuous values Uncertainty of data is rarely documented Jim Graham, Humboldt State University
Modeling Data Modeling provides unprecedented opportunities to create datasets required for research And to increase the uncertainty without telling anyone! Just about any data that is provide as a raster but is based on points is modeled Includes most subsurface and submarine data Most weather rasters are modeled Point -> Raster (e.g. PRISM) Jim Graham, Humboldt State University