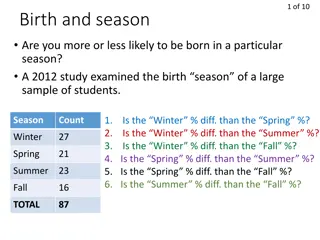
Understanding Risks and Associations in Statistical Analysis
Explore concepts like absolute, relative, and attributable risks, differences in means or proportions, odds ratio, relative risk, correlation coefficient, and more in statistical analysis scenarios involving laboratory results and physical activity measurement.

Download Presentation

Please find below an Image/Link to download the presentation.
The content on the website is provided AS IS for your information and personal use only. It may not be sold, licensed, or shared on other websites without obtaining consent from the author. Download presentation by click this link. If you encounter any issues during the download, it is possible that the publisher has removed the file from their server.
E N D
Presentation Transcript
Outcomes or differences that we are interested in: Differences in means or proportions Odds ratio (OR) association of two variables Relative Risk (RR) association of two variables Correlation coefficient association of two variables
Outcomes or differences that we are interested in: Differences in means or proportions Odds ratio (OR) association of two variables Relative Risk (RR) association of two variables Correlation coefficient association of two variables
Quantitative Correlation coefficient Qualitative Chi square ( 2) test Odds ratio, relative risk
Quantitative Correlation coefficient Qualitative Chi square ( 2) test Odds ratio, relative risk
Linearity and Direction are two concepts we are interested in Positive Linear Relationship Negative Linear Relationship Weak or Non-Linear Relationship
Correlation and Correlation coefficient and strength coefficient is of associations is the the measure measure of of direction direction strength of associations! !
A nurse wanted to be able to predict the laboratory HbA1c result (a measure of blood glucose control) from the fasting blood glucoses which she measured in her clinic. On 12 consecutive diabetic patients she noted the fasting glucose and simultaneously drew blood for HbA1c.
An occupational therapist developed a scale for measuring physical activity and wondered how much it correlated to Body Mass Index (BMI) in 12 of her adult patients.
Cross Table of two qualitative variables If first variable has r categories, second variable c categories, then we have an r c cross table. Cross Table is used to calculate association
Disease X YES NO TOTAL Genotype YPEL5 AA 2 0 2 AB 1 3 4 BB 0 4 4 TOTAL 3 7 10 Cross Table associations of YPEL5 genotypes with disease X
Cross Table is input for calculation of: risks, relative risk (RR), odds ratio (OR)
Risk is the probability that an event will happen. People at risk Risk of geting a disease in the exposure group: a/(a+b) Risk of geting a disease in the non-exposure group: c/(c+d)
If one in every 100 patients suffers a side- effect from a treatment, the risk is 1 100 = 0.01=1%
Calculated by dividing the risk in the treated or exposed group by the risk in the control or non-exposed group. R RR = exp osed R exp non osed RR=1 - no difference in risk between the groups RR>1 - the rate of the event is increased compared to controls. RR<1 - the rate of the event is reduced compared to controls.
Always check for 95% CI of RR!!! If 95% CI for a risk ratio does not include 1 1 (no difference in risk), it is statistically significant. RR=1 - no difference in risk between the groups RR>1 - the rate of the event is increased compared to controls. RR<1 - the rate of the event is reduced compared to controls.
A cohort of 1000 regular football players and 1000 non-footballers were followed to see if playing football was significant in the injuries that they received. After 1 year of follow-up there had been 12 broken legs in the football players and only four in the non-footballers. The risk of a footballer breaking a leg was therefore 12/1000 or 0.012. The risk of a non-footballer breaking a leg was 4/1000 or 0.004. The risk ratio of breaking a leg was therefore 0.012/0.004 which equals 3 The 95% CI was calculated to be 0.97 to 9.41. As the CI includes the value 1 we cannot exclude the possibility that there was no difference in the risk of footballers and non-footballers breaking a leg. However, given these results further investigation would clearly be warranted.
Used in cohort studies studies that follow a group (cohort) over a period of time and investigate the effect of a treatment or risk factor.
Used by epidemiologists in studies looking for factors which do harm It is a way of comparing patients who already have a certain condition (cases) with patients who do not (controls) a case control study . For rare events the relative risk (RR) rare events its value approximates that of
Calculated by dividing the number of times an event happens by the number of times it does not happen. Odds of cases being exposed: a/c Odds of controls being exposed: b/d
One boy is born for every two births, so the odds of giving birth to a boy are 1:1 (or 50:50) = 1 1 = 1 If one in every 100 patients suffers a side- effect from a treatment, the odds are 1:99 = 1 99 = 0.0101
Calculated by dividing the odds of having been exposed to a risk factor by the odds in the control group. a a d c = = OR b b c d OR=1 - no difference in risk between the groups (odds are same) OR>1 - the rate of the event is increased in patients who have been exposed to the risk factor. OR<1 - the rate of the event is reduced
Always check for 95% CI of OR!!! If 95% CI for a odds ratio does not include 1 1 (no difference in odds), it is statistically significant. OR=1 - no difference in risk between the groups (odds are same) OR>1 - the rate of the event is increased in patients who have been exposed to the risk factor. OR<1 - the rate of the event is reduced
cases controls smokers 156 (a) 221 (b) non-smokers 80 (c) 260 (d) OR = ad/bc = 2.29 Odds for cases (patients with cancer) being smokers are 2.29 times greater than for controls
Helpful in trying to work out how worthwhile a treatment is in clinical practice.
ARR is the difference between the event rate in the intervention group control group NNT is the number of patients who need to be intervention group and that in the control group. number of patients who need to be treated for one to get benefit. treated for one to get benefit. RRR is the proportion by which the intervention proportion by which the intervention reduces reduces the the event event rate rate.
ARR = improvement rate in the intervention group improvement rate in the control group = 80% 60% = 20%
NNT = 1/ARR=1/0.2=5 Or if you use percentages! NNT = 100/ARR=100/20%=5 Five women have to be treated for one to get benefit.
The incidence of candidiasis was reduced from 40% with placebo to 20% with treatment , i.e. by half. RRR=devide the absolute risk reduction by the control event rate= 20%/40%=50%