Compact Muon Radiography System for Investigation of Nuclear Reactor Fuel Status
A seminar presentation at LAL on May 23, 2013, discussed a compact muon radiography system designed for investigating the status of nuclear reactor fuel. The system, developed by researchers from the University of Tsukuba, involved the use of trackers with scintillators and muon detectors at various angles to assess reactor conditions. The timeline included key events such as the 2011 earthquake and subsequent investigation activities. Details of the detector system, scintillator components, and data acquisition processes were also outlined, highlighting the technical aspects of the project.

Download Presentation

Please find below an Image/Link to download the presentation.
The content on the website is provided AS IS for your information and personal use only. It may not be sold, licensed, or shared on other websites without obtaining consent from the author. Download presentation by click this link. If you encounter any issues during the download, it is possible that the publisher has removed the file from their server.
E N D
Presentation Transcript
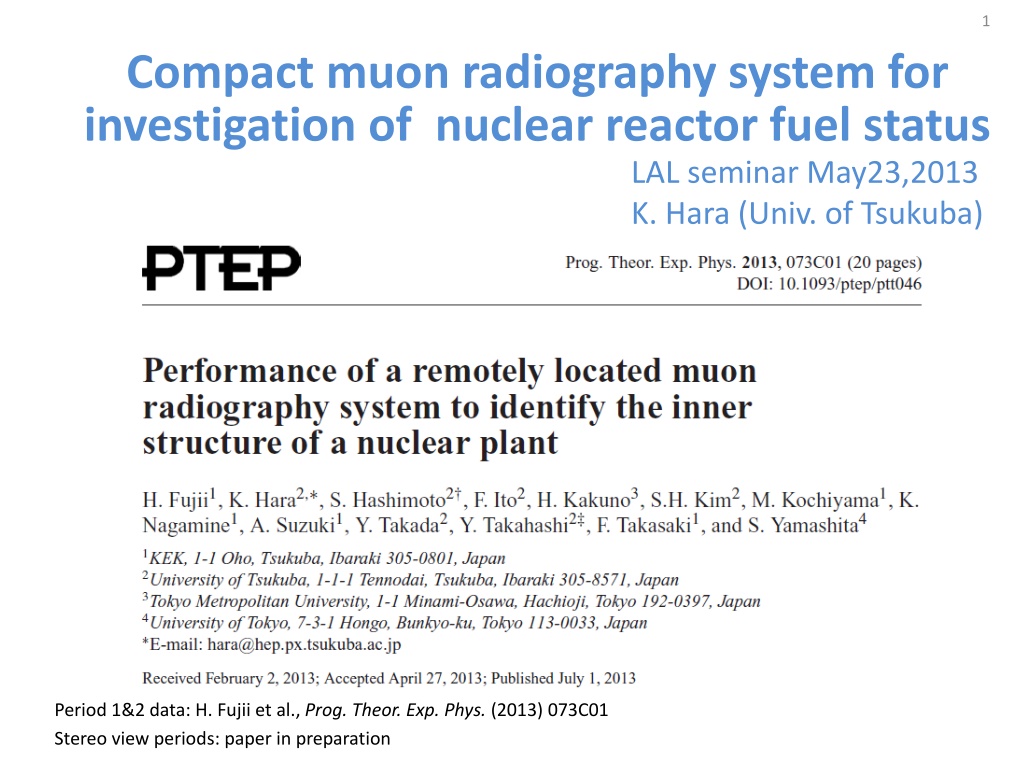
1 Compact muon radiography system for investigation of nuclear reactor fuel status LAL seminar May23,2013 K. Hara (Univ. of Tsukuba) Period 1&2 data: H. Fujii et al., Prog. Theor. Exp. Phys. (2013) 073C01 Stereo view periods: paper in preparation
2 Timeline 11 Mar. 2011 Gigantic earthquake followed by Tsunami 7 Apr. 2011 Proposal by K. Nagamine to KEK director A. Suzuki Members of KEK (led by F. Takasaki) started investigation Sep. 2011 U. Tsukuba joined, started design and construction of 1mx1m trackers using 1cm wide scintillators Mar. 2012 Detector#2 (Det#1 is by Nagamine using 3cm wide scintillators) started data taking at a Nuclear Plant. Position and elevation angle of Det#2 changed after 3-4 month data taking Feb. 2013 Detector#3 set at 90deg wrt Det#2 Dec. 2013 End of experiment at the Plant May.2014 Started discussion on application at FD
3 Unit1-3 reactor damaged Unit1,3,4 roof damaged Fuels in storage pools are safe
4 Muon flux 100 BESS @0deg Kirsch et.al. @75deg MURTON @89deg integral muon flux /m2/s/sr /GeV or 10 1 0.1 differential /m2/s/sr 0.01 0deg flux/GeV 0deg int Flux 0.001 75deg flux/GeV 75deg int Flux 0.0001 89deg int Flux 0.00001 0.1 1 10 100 1000 10000 100000 0.000001 0.0000001 muon momentum GeV/c
5 Detector system 2 XY units: 0.2 t Toroid: 5.3 t Container others: 3.5 t Placed in a 20-ft shipping container Clocks in 4 DAQ boxes are synchronized every 1 s
6 Scintillator + WLS fiber + MPPC scintillator m cm 6mm) Eljin EJ-200 Wavelength shifting (WLS) fiber (Kuraray Y11:200ppm 1mm dia Al reflector MPPC (1.3mm sensor 10mm TiO2 between gaps 0.5mm White reflective sheets for signal isolation Multipixel photon counter (Hamamatsu Photonics) Scintillator + WLS fiber : CDF endcap tile/fiber calorimeter MPPC : ILC calorimeter
7 MPPC gain uniformity & noise rate @room temperature
8 1mx(1cmx100) scintillator plane
9 MPPC DAQ System Provide biases (~71V) to 200 MPPCs Look for coincidence of XY planes (single cluster in each allowed) Clock: 125Mhz GHz 200 SMB coaxial cables/unit
10 DAQ system diagram amp f=15k-70MHz DACcom(16bit):0-1.6V DACofs(16bit):0-1.6V DAC70(16bit):61-79V FPGA coincidence window: 8ns-1.024us; area=1-4 consecutive hits in X/Y; 1GHz time stamp
11 XY Unit with DAQ box
XY Unit with DAQ box DAQ box 116.9cm 116.9cm 10.65cm
13 Typical GE Mk-II reactor Building above ground 40-50m cubic Dryer separator pool (not drawn) Fuel storage pool Pressure vessel (PVC) Containment vessel Fuel object to load (4m) cubic (not drawn)
14 64m from the reactor center First two Periods
15 System located in 20 container PERIOD2: Thermal insulation is placed on walls PERIOD1: U1-U2=20cm Targeting fuel loading zone
16 First data taking periods Period-1: targeting fuel loading zone Y(U1-U2)=20cm with L(U1-U2)=1.5m Period-2 : targeting fuel storage pool Y(U1-U2)=60cm with L(U1-U2)=1.5m Spread of the trigger rate in Period-1 caused by temperature variation due to insufficient isolation added isolation, temperature threshold correction applied at start of run
17 Horizontal Distributions (Period-1 ) in Vertical slices
18 2D image (Period 1) Acceptance effect is removed by subtracting low-frequency components in Fourier series
19 19 2D image (Period 1) 2D image (Period 1) Fuel storage pool Dryer separator pool Building wall (projective) Fuel loading zone Containment vessel Pressure vessel (PVC)
20 Resolution study (1) Almost projective wall supporting the Dryer Separator pool (Depth~13m) Fitted resolution: 49.1 2.7 cm
21 Resolution study (2) We found a change of the water level in DSP (details in next pages) Event yield (nominal water level/reduced water level) Shape well reproduced by x=50 cm assumption
22 Detected yield variation Reduced water level Back to nominal Start of Period-1 Weekly tracking of the yield detected a yield variation in DSP region plant representative provided us the record of water levels in DSP
23 Change of water level in DSP Change of water level follows as provided (a few days for some of the data periods ) Yields normalized here
What happened in whole view 31days/45days, normalized (note: view targeting fuel loading zone) During DSP water level is reduced Water level in RPV is reduced Plug shield is placed
25 Absence of the fuel PRV region compared with GEANT assuming: fuel is loaded fuel is not loaded but filled with water nothing inside fuel = UO with 2.5g/cc density Data distribution around the CV walls is well reproduced by GEANT with the assumption that fuel is absence The plant has been not in operation since 11.3.2011
26 Comparison in other Y-slices Fuel loading zone height
27 Period-2 distribution Data in fuel storage pool region compared with GEANT with assumed fuel thicknesses (0,4,8m in depth) evaluate the depth profiled high density material (can not explained by water only=0m assumption) Up to 8m in depth. Clustered in two?
28 Density-length distribution WEL
29 Detectors-3 30m Detector-2-2 Detector-2-1 61m 64m Stereo View Periods
30 Detector system 3 2 units 100kg Support 30kg Air-cond 70kg PC others 20kg House 300kg XY unit 1 XY unit 2 DAQ1 DAQ2 1.5m 1600 1.8x2.7x2.4m 1900 Super house
31 Stereo View Periods Fuel Storage Pool Containment Vessel Detector 2 Point 2 Detector 3 Point 3 Detector 2 Point 1
32 Improved DAQ Timing front coming back coming 8ns in Period-1 1ns version Front (reactor) X Signal stretched to 8ns x N to evaluate coincidence Y Unit time stamp (8ns 1ns)
33 Timing resolution Corrected for track angle and signal propagation Timing resolution=1.4-1.7 ns
34 New planes with FNAL scintillator bars Scintillator (1m 1m 10mm) TiO2 paint MPPC (1.3 mm sensor WLS fiber (1mm dia 10mm 9.5mm scintillator, extruded with 3mm dia hole 4 sides coated with TiO2 Scintillator bars w/ paint fabricated by FNAL (group of Anna-Pla)
35 Light yield Light yield was measured using penetrating Sr-90 -rays D=75cm Sr-90 white paint MPPC to amp&ADC 5x10 MPPC to amp&ADC gate
36 Plane uniformity, example X Y Unit placed horizontally Vth of Y set low when X was in investigation Vth was determined to suppress noise
37 In-situ efficiency measurement Select hits in U1,U2,U4 |U2-(U1+U4)/2|<5cm Overall efficiency of U3: 88-89% in good area
38 Point 1 View Building Wall Building Wall Timber Timber Beam Beam Containment Vessel Containment Vessel Pressure Vessel Pressure Vessel http://www.japc.co.jp/plant/images/plant_guide_tokai_tokai2_4.jpg Horizontal Horizontal Plane Plane Acceptance corrected (assuming cos2 ) Darkness~ ln(observed/expected) measured empty at KEK
39 Point 2 View Wall of the Wall of the Reactor Building Reactor Building Container Vessel Container Vessel Pressure Vessel Pressure Vessel Horizontal Plane Horizontal Plane
40 Point 3 View Container Container Vessel Vessel Horizontal Plane Horizontal Plane
41 Area with large absorption Point-1 (173days,1524kEv) Point-2 (94days,722kEv) Point-3 (208days,816kEv) Points with larger absorption, -ln(Nobs/Nexp)>1.35,1.4,1.9, distribute inside the fuel storage pool Mesh the pool at (1m)3and color the mesh if two of the three say heavy
42 Distributions of heavy objects Period-2 view Period-2 view (behind) Reconstructed distribution of heavy objects
43 Discussion with TEPCO started two detectors for U1; get result in FY2014 (by Mar 2015) scattering method detector for U2; be ready in FY2015
44 Radiation levels http://www.tepco.co.jp/nu/fukushima-np/f1/surveymap/images/f1-sv-20140410-j.pdf
45 Possible system for Fukushima Daiichi
46 View at 30 m -12o front unit-to-unit = 2m (fine view) unit-to-unit = 1m (coarse view)
47 Effect of Fe shield Image viewed by rear tracker set behind 61-cm thick iron Data corresponds to 10 days GEANT simulation resulted: No deterioration in image 10% of events associated with >1 hits
48 Noise coincidence Noise coincidence rate was measured using Co-60 . Radiation level evaluated using film budges 12 600 Pb+Fe Pb+Fe (~2mSv/h) Pb (~15mSv/h) 10 500 0.24V 0.24V 20cm-20cm Rate [Hz] 20cm-20cm Rate [Hz] 0.34V 0.34V 8 400 6 300 4 200 2 100 0 0 0 20 40 60 80 0 20 40 60 80 Coincidence Time Window [ns] Coincidence Time Window [ns] Noise rate increases linearly with the coincidence time window: Purely accidental
49 No shield 5cm Fe shield 10cm Fe shield 15cm Fe shield Radiation effects in tracking Nominal Vth=0.30 V Noise rate measured under C-60 irradiation *be compared with event rates (0.3-1 Hz) largely relaxed for three unit system
50 GEANT: Absorption by Cubic Fuels (Period-1 condition) Assume S>5 to identify