Machine Learning for Molten Salt Reactor Safeguards
Molten salt reactors face challenges in material accounting due to liquid fuel which precludes traditional safeguards. This project proposes a two-step approach involving the development of measurement signatures created by material diversion, and a machine learning model to distinguish normal reactor operation from material diversion based on these signatures. High actinides, neutron capture on 238U, and deviations in fission fractions are key factors in creating diversion signatures. The project utilizes a reactor model based on uranium-fueled MSR designs, modeling tools like Serpent and SCALE, and considers isotope concentrations via different methods to enhance safeguards. By leveraging the strengths of both Serpent and SCALE, the project aims to improve the accuracy and efficiency of reactor safeguarding measures.
Uploaded on Sep 12, 2024 | 1 Views
Download Presentation

Please find below an Image/Link to download the presentation.
The content on the website is provided AS IS for your information and personal use only. It may not be sold, licensed, or shared on other websites without obtaining consent from the author. Download presentation by click this link. If you encounter any issues during the download, it is possible that the publisher has removed the file from their server.
E N D
Presentation Transcript
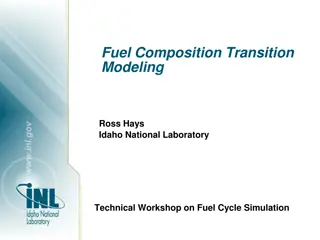
Use Use of of Machine Machine Learning for for Molten Molten Salt Salt reactor Branko Kovacevic, Andre Vidal Soares, William J. Walters, and Amanda M. Johnsen Ken and Mary Alice Lindquist Department of Nuclear Engineering Penn State University Learning Models reactor Safeguards Safeguards Models
Molten Salt Reactor (MSR) Safeguards Molten salts play a role in many advanced reactor concepts, either as just coolants or with dissolved fissile elements (fuel salt). Reactors using molten fuel salts face material accounting challenges, as liquid fuel: precludes application of traditional item-counting safeguards and introduces new material diversion opportunities. Although there are different ideas on how to safeguard MSR material, this project takes a two-step approach: develop measurement signatures created by material diversion, and develop a machine learning model that uses those measurement signatures to distinguish normal reactor operation from operation with material diversion 2
The Basis for Diversion Signatures Higher actinides (HA) are created via (n, ) and Pu decay, so HA concentrations decrease with Pu removal. Many HA undergo SF or -decay and are thus a major source of neutrons and - particles. Neutron capture on 238U drives plutonium production Fraction of 239Pu fissions increases throughout the reactor cycle Removal of Pu forces an increase in the number of 235U fissions Deviation of fission fractions from the expected values causes deviations in the isotope inventory 3
The Reactor Model The proposed approach works best with uranium-fueled MSRs. The reactor was modeled in Serpent and SCALE, based on the MSDR with changes that bring it closer to proposed reactor designs. Continual removal of chemically insoluble noble metals (Se, Nb, Mo, Tc, Ru, Rh, Pd, Ag, Sb, and Te) and gases (He, N, O, Ar, Kr, and Xe) Diversion scenario assumes full and exclusive Pu removal as other scenarios present a lesser detection challenge. 4
Serpent Versus SCALE Isotope Concentrations SCALE and Serpent use different methods of modeling reactor operations, so some differences in resulting isotope concentrations are inevitable. SCALE fails to remove isotopes that lack cross-sections into the noble metal and off- gas streams, diminishing their lineup of features. The solution is to use the strengths of each code: Serpent was leveraged to obtain the correct material stream concentrations and SCALE s Sampler module was used to perturb the Serpent-generated concentrations to account for nuclear data uncertainties. To minimize the Monte Carlo uncertainty affecting Serpent simulations, they were repeated multiple times and averaged before being perturbed via Sampler. 5
Measurement Signatures Modeling Reactor operation (normal and operation with various plutonium diversion scenarios) modeled in Serpent. SCALE Sampler used to introduce isotope- dependent nuclear data uncertainty (fission yield, decay data and reaction cross sections) and model reactor operation 10,000 times for each case. Spectra peak areas extracted from measurement signatures and passed on to machine learning classifiers as features Resultant Serpent concentrations and Sampler perturbed concentrations are combined. The results from each perturbed reactor simulation are used to model gamma-ray spectra, neutron counting, and alpha spectra signatures 6
Simulated Gamma-ray Signatures Modeled in GADRAS: HPGe detector (10 s dead time, 6 s shaping time) with Poisson noise. Sample activities from the fuel salt, noble metals, and off-gas streams were optimized for the highest number of counts. Peak areas calculated using a region-of-interest method and subtracting local Compton continuum in identified peaks. 1 SQ diversion causes end-of-cycle peak areas show differences of up to 0.25%. Peak area standard deviations are mostly dependent on isotopic nuclear data uncertainty. Isotope End-of-cycle 1 SQ protracted versus reference gamma-ray spectra signatures for a fuel salt sample decayed for 12 hours 239Pu 91Sr 238Np 106Ru Nuclear data uncertainty, % 1.54 0.42 5.58 1.05 7
Simulated Alpha-Particle Signatures Although samples require more preparation for alpha measurements, here they were modeled without any separations. Modeled in a simple MCNP geometry through an F8 pulse height distribution tally with Gaussian energy broadening parameters for a PIPS detector. Despite many alpha-emitters in used fuel salt samples, a handful of actinides dominate the alpha spectra due to their concentrations and emission properties. The high concentration and high alpha emission energies of 242Cm complicate the modeled measurements. If the sample is sufficiently thin and collimated it is possible to produce useful spectra. Separating the curium isotopes would put fewer constraints on sample size and geometry. 8
Simulated Alpha-Particle Signatures The need for alpha spectra arises as neutron emissions are affected by the high nuclear data uncertainty of 242Cm. Luckily, the modeled fuel salt alpha spectrum delivers three clearly separated peaks. As neutron signatures are dominated by 242Cm, the 6.1 MeV alpha spectra peak makes them redundant. Isotope Peak Energy, MeV Peak area difference,% Area standard deviation, % 239Pu+240Pu 5.1 -0.533 1.42 241Am+238Pu 5.5 -0.536 2.51 242Cm 6.1 -0.429 3.93 Favorable feature statistics make these peaks instrumental for the machine learning model. 9
Machine Learning Approach If 1 SQ Pu diversion is the goal, it is clear individual signatures are not sufficient for confident detection of diversion. Machine learning can synthesize a multitude of diverse signatures to examine how accurately plutonium diversion could be detected while accounting for the most consequential detection physics and sources of uncertainty: The goal is to select the highest performing machine learning algorithms, feature combinations and model parameters. Identification of most useful measurement signatures can be used to suggest reactor design features that enable their collection. 10
Machine Learning Approach The datasets are split into training and testing portions in a 3:1 ratio. Each feature is standardized to a mean of 0 and a standard deviation of 1 to avoid favoring the effects of features with larger magnitudes. Tested various classification algorithms from the Sklearn library (Support Vector Machines, K-neighbors classifier, Random Forest Classifier ) Algorithms from the Support Vector Machine family generally outperformed the rest as judged through classification accuracy: ?????????????? ???????? % = ??????? ??????????????? As each spectra contains hundreds of peaks it was necessary to select the most favorable ones, because every peak introduces too much noise and lowers classification accuracy. ??? ???? ??????????????? 100 11
Feature Selection Model performance is improved via certain feature characteristics: YES: features with low standard deviations between different perturbed simulations NO: features with high peak area differences and higher standard deviations. Some ML algorithms provide feature importance ratings, which were employed to construct a feature-selection methodology. This is a computationally less expensive technique than out-of-the-box methods such as Recursive Feature Elimination with Cross Validation and ANOVA variance analysis. Feature selection brings the number of features to a few dozen for the highest-performing datasets 12
Uncertainty Quantification Nuclear data uncertainty from Sampler introduces isotopic modeling uncertainty. Modeling Poisson counting noise accounts for some measurement uncertainty. Machine learning model s epistemic uncertainty is modeled through bootstrapping performing classifications with different training and testing splits and aggregating the results. Peak area counting uncertainty is calculated according to the equation: 2 2 ????= ????? ???? + ?????????? ??????? These are propagated into the overall uncertainty assuming they are independent: 2 2 2 ?????= ????????? + ??????? 1 + ??????? 2 + Other forms of modeling uncertainty (temperature, density etc.) would make the problem more challenging. 13
Results The results are highly dependent on which samples are used samples and their features. Using gamma-ray spectra from individual decay steps leads to low distinction between the cases. With a diverse lineup of material streams, decay steps and alpha spectra it is possible to distinguish between reference and 1 SQ Pu diversion reactor operation to a high degree. The highest results were achieved with an SVM classifier with a linear kernel Reference VS 1 SQ protracted diversion classification accuracy 14
Four Diversion Scenarios Were Examined 1. Constant rate protracted 1 SQ Pu diversion throughout the reactor cycle. Abrupt removal of 1 SQ of Pu conducted in one day at the end of 3rd quarter of reactor operation. Protracted diversion of 1 SQ of Pu starting after four years of operation until the end of reactor cycle. Protracted diversion of 10 SQ of Pu that was examined at 810 days of reactor operation the point when 1 SQ has been diverted. 2. 3. 4. 15
Most Important Features Dominant Isotope Material stream and decay step Energy, keV Peak area standard deviation, % Difference, 1 SQ Protracted reference, % Importance Correlation with 239Pu A good mix of features from various material streams When alpha spectra features are used, the isotopes with high correlations with 239Pu grow in importance Alpha spectra features make notable contributions only when 239Np features are present Almost all high-importance features have low nuclear data uncertainty 239/240Pu Alpha 0.81 5,100 1.42 -0.526 11.14 242Cm Alpha 0.16 6,100 3.93 -0.440 3.73 0.09 127Sb 772.1 0.600 -0.023 2.58 NM12 hrs. 0.016 132Te 228.1 0.620 -0.015 2.15 NM 12 hrs. 0.96 239Np 106.3 0.972 0.008 2.07 FS 5 days -0.08 133Xe 81.2 0.319 -0.019 2.05 Off gas 12 hrs. 0.96 239Np 277.0 0.998 0.008 2.02 FS 5 days Different diversion cases use largely the same features, but depending on isotopes half-life the peak area changes differ 16
Model Verification and Conclusions The machine learning results seem promising even for very challenging plutonium diversion scenarios. However, it is difficult to verify the reactor model and isotopic compositions without an operating MSR. But there are some ways to further improve this work: incorporating measurements from the MSRE experiment (18 fission products monitored); enabling Bayesian data integration via experimental results could decrease isotopes nuclear data uncertainty; and using parameter bounding (e.g., selecting only simulations with k-eff within 300 pcm of an unperturbed model delivers significant improvements in concentration standard deviation of isotopes correlated to reactor power - increase of 2-3% in classification accuracy) . 17
QUESTIONS? 18


