Opioid, Benzodiazepine, and Gabapentin Prescription Trends in Tennessee 2016-2020

This report highlights the trends in opioid, benzodiazepine, and gabapentin prescriptions in Tennessee from 2016 to 2020. It addresses the increasing rates of drug overdose deaths, particularly opioid-related deaths. The data presented shed light on the measures and trends to combat the opioid crisis in Tennessee, showcasing declines in opioid and benzodiazepine prescriptions while noticing consistent rates in gabapentin prescriptions. The report emphasizes the importance of controlled substance monitoring through the CSMD program to track prescribing patterns and patient histories.

Download Presentation

Please find below an Image/Link to download the presentation.
The content on the website is provided AS IS for your information and personal use only. It may not be sold, licensed, or shared on other websites without obtaining consent from the author. Download presentation by click this link. If you encounter any issues during the download, it is possible that the publisher has removed the file from their server.
E N D
Presentation Transcript
Opioid, Benzodiazepine, and Gabapentin Prescription Trends in Tennessee 2016-2020
Introduction The following slides are a summary of Opioid, Benzodiazepine and Gabapentin Prescription Trends in Tennessee in Tennessee s Annual Overdose Report for 2021. This report was produced by the Office of Informatics & Analytics (OIA) at the Tennessee Department of Health (TDH) and can be found on TDH s Drug Overdose website. While these slides will specifically focus on the most recent findings for Opioid, Benzodiazepine and Gabapentin Prescription Trends in Tennessee, additional slides and the 2021 report itself will provide information on each the following: Non-fatal drug overdose hospital discharges in Tennessee Opioid, benzodiazepine and gabapentin prescription trends Ongoing epidemiologic analyses Our data-driven support of licensure and over-prescribing investigations Dissemination of data at the county level The statewide drug overdose reporting system for healthcare facilities A summary of the Hal Rogers & Comprehensive Opioid Abuse Site-based Programs (COAP) grants, which provide key support for collaboration with mental health and law enforcement through data sharing Indicators that are currently being traced in an ongoing way through the integrated data system The development, specifications, and purpose of the integrated data system Partnership with the Opioid Response Coordinating Office (ORCO) to further enhance surveillance for both nonfatal and fatal overdoses
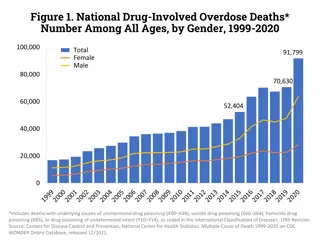
A Note from the Executive Summary Tennessee continues to face a severe opioid crisis. From 2016 to 2020: The rates of all drug overdose deaths increased, regardless of race The rate of opioid overdose deaths also increased to an age-adjusted rate of 31.2 per 100,000 residents The number of heroin overdose deaths increased from 205 to 380 The number of overdose deaths involving fentanyl (largely due to illicitly manufactured fentanyl), increased from 169 to 1,087 Opioid and benzodiazepine deaths, while remaining high, decreased for the third consecutive year This report provides key epidemiologic data on risk measures and trends to understand and respond to the opioid epidemic in TN. Specifically, these slides will focus on Opioid, Benzodiazepine and Gabapentin Prescription Trends in TN from 2016-2020 and highlight these epidemiologic data trends: The number of opioid prescriptions for pain filled in TN has continued to decline The number of filled benzodiazepine prescriptions is also continuing to decline Gabapentin prescriptions became reportable to the CSMD in July 2018 and the prescribing rate has remained consistent over the past two years
Prescription Data Collection Controlled Substance Monitoring Database (CSMD) The prescription drug monitoring program provides information about controlled substance prescribing patterns for patients, dispensers, and healthcare providers Dispensers are required to report all controlled substances dispensed within one business day Healthcare providers in TN are required to use the CSMD to query a patient s prescription history prior to the beginning a new course of treatment CSMD data contain information about each filled prescription for a controlled substance including the specific drug prescribed, National Drug Code number, strength, quantity, and days supply along with identifying information about patients Dispensation Data are transmitted to Appriss (the state s vendor in charge of the CSMD), with daily updates provided to TDH s Office of Informatics and Analytics (OIA) TDH s Office of Informatics and Analytics uses the data to create indicators of TN prescribing patterns at the prescription, patient, prescriber, and dispenser levels.
Prescription Trends in Tennessee
Prescription Data Number of Opioid, Benzodiazepine, and Gabapentin Prescriptions in TN by Quarter for 2016-2020* *Analysis conducted by the Office of Informatics and Analytics, TDH (last updated January 15, 2021). Limited to TN residents. Data Source: Controlled Substance Monitoring Database.
Prescription Data Number of Opioid, Benzodiazepine, and Gabapentin Prescriptions in TN by Quarter for 2016-2020* The numbers of filled opioid prescriptions for pain and filled benzodiazepine prescriptions have continued to decline between 2016 and 2020, with slight increase Q2 2020 to Q3 2020 Gabapentin prescription reporting requirements to the CSMD began July 2018 and has remained consistent over the last year *Analysis conducted by the Office of Informatics and Analytics, TDH (last updated January 15, 2021). Limited to TN residents. Data Source: Controlled Substance Monitoring Database.
Prescription Data Patients Receiving Opioid, Benzodiazepine, and Gabapentin Prescriptions in TN by Quarter for 2016-2020* *Analysis conducted by the Office of Informatics and Analytics, TDH (last updated January 15, 2021). Limited to TN residents. Data Source: Controlled Substance Monitoring Database.
Prescription Data Patients Receiving Opioid, Benzodiazepine, and Gabapentin Prescriptions in TN by Quarter for 2016-2020* The number of patients who have filled prescriptions for opioids for pain and benzodiazepines has declined between 2016 and 2020, with slight increase from Q2 2020 to Q3 2020 The number of patients filling gabapentin prescriptions has remained consistent since reporting began in July 2018 *Analysis conducted by the Office of Informatics and Analytics, TDH (last updated January 16, 2020). Limited to TN residents. Data Source: Controlled Substance Monitoring Database.
Prescription Data Prescription Rate of Top 3 Most Prescribed Short-Acting Opioids for Pain in TN by Quarter for 2016-2020* *Analysis conducted by the Office of Informatics and Analytics, TDH (last updated January 15, 2021). Limited to TN residents. Data Source: Controlled Substance Monitoring Database.
Prescription Data Prescription Rate of Top 3 Most Prescribed Short-Acting Opioids for Pain in TN by Quarter for 2016-2020* Hydrocodone is consistently the most commonly prescribed short-acting opioid for pain Each top prescribed opioid increased in rate from Q2 2020 to Q3 2020 *Analysis conducted by the Office of Informatics and Analytics, TDH (last updated January 15, 2021). Limited to TN residents. Data Source: Controlled Substance Monitoring Database.
Prescription Data Prescription Rate of Top 4 Most Prescribed Benzodiazepines in TN by Quarter for 2016-2020* *Analysis conducted by the Office of Informatics and Analytics, TDH (last updated January 15, 2021). Limited to TN residents. Data Source: Controlled Substance Monitoring Database.
Prescription Data Prescription Rate of Top 4 Most Prescribed Benzodiazepines in TN by Quarter for 2016-2020* Alprazolam is prescribed nearly 2 to 3 times the rate of the other benzodiazepines The rate of filled Alprazolam prescriptions continued to decrease from 2016 to 2020 *Analysis conducted by the Office of Informatics and Analytics, TDH (last updated January 15, 2021). Limited to TN residents. Data Source: Controlled Substance Monitoring Database.
Prescription Data Rate of Opioid Prescriptions for Pain Filled by TN County of Residence for 2020* Prescription rates for opioids for pain were lower in 2020 compared to 2019 across all counties Despite this decrease, 40 of the 95 counties have a rate above 1,000 prescriptions per 1,000 residents Prescription rates tend to be low in the most populous counties and highest in rural areas *Analysis conducted by the Office of Informatics and Analytics, TDH (last updated February 2, 2021). Limited to TN residents. Data Source: Controlled Substance Monitoring Database.
Prescription Data Rate of Benzodiazepine Prescriptions Filled by TN County of Residence for 2020* In 2020, the rate of filled benzodiazepine prescriptions was lower compared to 2019 in 86 of 95 counties The counties with the highest benzodiazepine prescription rates in 2020 were in large portions of West TN and Northeast TN *Analysis conducted by the Office of Informatics and Analytics, TDH (last updated February 2, 2021). Limited to TN residents. Data Source: Controlled Substance Monitoring Database.
Prescription Data Rate of Gabapentin Prescriptions Filled by TN County of Residence for 2020* On July 1, 2018, required reporting began on gabapentin and has been used as an alternative to opioids for pain management Prescription rates tend to be highest in the areas around the northern part of East TN and the southern part of Middle TN *Analysis conducted by the Office of Informatics and Analytics, TDH (last updated February 2, 2021). Limited to TN residents. Data Source: Controlled Substance Monitoring Database.
Payment for Prescriptions in Tennessee
Prescription Data Payment Type for Opioid Prescriptions for Pain in TN by Quarter for 2016-2020* *Analysis conducted by the Office of Informatics and Analytics, TDH (last updated January 15, 2021). Limited to TN residents. Data Source: Controlled Substance Monitoring Database.
Prescription Data Payment Type for Opioid Prescriptions for Pain in TN by Quarter for 2015-2019* From 2016 to 2020, the most common payment type for opioid prescriptions for pain was commercial insurance followed by Medicare From 2016 through 2017, prescriptions paid through cash and Medicaid were roughly equal, but prescriptions paid for by Medicaid shrank in 2018 and through most of 2020 Analysis conducted by the Office of Informatics and Analytics, TDH (last updated January 15, 2021). Limited to TN residents. Data Source: Controlled Substance Monitoring Database.
Prescription Data Payment Type for Benzodiazepine Prescriptions in TN by Quarter for 2016-2020* Analysis conducted by the Office of Informatics and Analytics, TDH (last updated January 15, 2021). Limited to TN residents. Data Source: Controlled Substance Monitoring Database.
Prescription Data Payment Type for Benzodiazepine Prescriptions in TN by Quarter for 2016-2020* From 2016 to 2020, the most common payment type for benzodiazepine prescriptions was commercial insurance, followed by Medicare, cash, other payment types, and Medicaid Analysis conducted by the Office of Informatics and Analytics, TDH (last updated January 15, 2021). Limited to TN residents. Data Source: Controlled Substance Monitoring Database.
Patient Trends in Receiving Prescription Drugs in Tennessee
Prescription Data Patients Receiving Opioid Prescriptions for Pain by Days Supply in TN by Quarter for 2016-2020* *Analysis conducted by the Office of Informatics and Analytics, TDH (last updated January 15, 2021). Limited to TN residents. Data Source: Controlled Substance Monitoring Database.
Prescription Data Patients Receiving Opioid Prescriptions for Pain by Days Supply in TN by Quarter for 2016-2020* The most common length of opioid prescription from 2016 to 2020 was 21-30 days The least common length of opioid prescription from 2016 to 2020 was 11-20 days *Analysis conducted by the Office of Informatics and Analytics, TDH (last updated January 15, 2021). Limited to TN residents. Data Source: Controlled Substance Monitoring Database.
Prescription Data Patients Receiving Benzodiazepine Prescriptions by Days Supply in TN by Quarter for 2016-2020* *Analysis conducted by the Office of Informatics and Analytics, TDH (last updated January 15, 2021). Limited to TN residents. Data Source: Controlled Substance Monitoring Database.
Prescription Data Patients Receiving Benzodiazepine Prescriptions by Days Supply in TN by Quarter for 2016-2020* The most common length of benzodiazepine prescription from 2016 to 2020 was 21-30 days From 2016 to 2020, prescriptions filled for any timeframe under 20 days were filled for shorter lengths of time *Analysis conducted by the Office of Informatics and Analytics, TDH (last updated January 15, 2021). Limited to TN residents. Data Source: Controlled Substance Monitoring Database.
Prescription Data Prescription Rate of Patients Receiving Opioids for Pain by Sex in TN by Quarter for 2016-2020* *Analysis conducted by the Office of Informatics and Analytics, TDH (last updated January 15, 2021). Limited to TN residents. Data Source: Controlled Substance Monitoring Database.
Prescription Data Prescription Rate of Patients Receiving Opioids for Pain by Sex in TN by Quarter for 2016-2020* Opioid prescriptions for pain were filled at a higher rate by females from 2016 to 2020 Both males and females had a decrease in the rate of patients receiving opioids for pain at roughly the same rate *Analysis conducted by the Office of Informatics and Analytics, TDH (last updated January 15, 2021). Limited to TN residents. Data Source: Controlled Substance Monitoring Database.
Prescription Data Prescription Rate of Patients Receiving Benzodiazepines by Sex in TN by Quarter for 2016-2020* *Analysis conducted by the Office of Informatics and Analytics, TDH (last updated January 15, 2021). Limited to TN residents. Data Source: Controlled Substance Monitoring Database.
Prescription Data Prescription Rate of Patients Receiving Benzodiazepines by Sex in TN by Quarter for 2016-2020* Benzodiazepine prescriptions were filled at a higher rate by females from 2016 to 2020 Both males and females had a decrease in the rate of patients receiving benzodiazepines, but there was a slight increase in the rate from Q2 to Q3 2020 *Analysis conducted by the Office of Informatics and Analytics, TDH (last updated January 15, 2021). Limited to TN residents. Data Source: Controlled Substance Monitoring Database.
Prescription Data Prescription Rate of Patients Filling Gabapentin by Sex in TN by Quarter for 2018-2020* *Analysis conducted by the Office of Informatics and Analytics, TDH (last updated January 15, 2021). Limited to TN residents. Data Source: Controlled Substance Monitoring Database.
Prescription Data Prescription Rate of Patients Filling Gabapentin by Sex in TN by Quarter for 2018-2020* Gabapentin prescriptions were filled at a higher rate by females from Q3 2018 to 2020 The rates for both males and females have held relatively steadily across this period *Analysis conducted by the Office of Informatics and Analytics, TDH (last updated January 16, 2020). Limited to TN residents. Data Source: Controlled Substance Monitoring Database.
Prescription Data Prescription Rate of Patients Receiving Opioids for Pain by Age in TN by Quarter for 2016-2020* *Analysis conducted by the Office of Informatics and Analytics, TDH (last updated January 15, 2021). Limited to TN residents. Data Source: Controlled Substance Monitoring Database.
Prescription Data Prescription Rate of Patients Receiving Opioids for Pain by Age in TN by Quarter for 2016-2020* Older age groups filled opioid prescriptions for pain at higher rates than younger age groups from 2016 to 2020 All age groups had a decrease in rates between 2016 to 2020, with age groups 25-54 having the sharpest rate decrease All age groups had an increase in prescriptions between Q2 2020 and Q3 2020 *Analysis conducted by the Office of Informatics and Analytics, TDH (last updated January 15, 2021). Limited to TN residents. Data Source: Controlled Substance Monitoring Database.
Prescription Data Prescription Rate of Patients Receiving Benzodiazepines by Age in TN by Quarter for 2016-2020* *Analysis conducted by the Office of Informatics and Analytics, TDH (last updated January 15, 2021). Limited to TN residents. Data Source: Controlled Substance Monitoring Database.
Prescription Data Prescription Rate of Patients Receiving Benzodiazepines by Age in TN by Quarter for 2016-2020* Patients 65 years and older had the highest rate of benzodiazepine prescriptions filled for pain from 2016 to 2020 All age groups had a decrease in rates between 2016 to 2020, but older age groups decreased somewhat faster than younger groups *Analysis conducted by the Office of Informatics and Analytics, TDH (last updated January 15, 2021). Limited to TN residents. Data Source: Controlled Substance Monitoring Database.
Prescription Data Prescription Rate of Patients Filling Gabapentin by Age in TN by Quarter for 2018-2020* *Analysis conducted by the Office of Informatics and Analytics, TDH (last updated January 15, 2021). Limited to TN residents. Data Source: Controlled Substance Monitoring Database.
Prescription Data Prescription Rate of Patients Filling Gabapentin by Age in TN by Quarter for 2018-2020* Patients 65 years and older had the highest rate of gabapentin prescriptions filled for pain from Q3 2018 to 2020 The rate of patients filling gabapentin prescriptions has remained steady or decreased slightly for age groups between 25 and 54 *Analysis conducted by the Office of Informatics and Analytics, TDH (last updated January 15, 2021). Limited to TN residents. Data Source: Controlled Substance Monitoring Database.
Prescription Data Active Prescription Days for Patients Filling Opioids for Pain in TN from 2016-2020* Prescription Days 2016 2017 2018 2019 2020 1-7 days 47.9% 49.3% 53% 57.9% 57.6% 8-30 days 21.8% 21% 18.4% 15.5% 15.8% 31-90 days 8.8% 8.4% 7.5% 6.2% 6.2% 91-180 days 5.3% 5% 4.7% 4.2% 4% 181-270 days 4% 3.8% 3.8% 3.4% 3.3% >270 days 12.2% 12.4% 12.6% 12.8% 13.2% *Analysis conducted by the Office of Informatics and Analytics, TDH. Limited to TN residents. Data Source: Controlled Substance Monitoring Database. Inclusive of all prescriptions in the drug class for each patient during the year. This measure assumes patients take their entire prescription as directed. See Appendix B6 of the 2021 Tennessee Annual Overdose Report for more information.
Prescription Data Active Prescription Days for Patients Filling Opioids for Pain in TN from 2016-2020* From 2016 to 2020, the percent of patients receiving a week or less of opioids for pain has generally increased across this period while the percent decreased for most other active prescription days categories, however, the percentage of patients who filled more than 270 days of opioids in a year has slightly increased Prescription Days 2016 2017 2018 2019 2020 1-7 days 47.9% 49.3% 53% 57.9% 57.6% 8-30 days 21.8% 21% 18.4% 15.5% 15.8% 31-90 days 8.8% 8.4% 7.5% 6.2% 6.2% 91-180 days 5.3% 5% 4.7% 4.2% 4% 181-270 days 4% 3.8% 3.8% 3.4% 3.3% >270 days 12.2% 12.4% 12.6% 12.8% 13.2% *Analysis conducted by the Office of Informatics and Analytics, TDH. Limited to TN residents. Data Source: Controlled Substance Monitoring Database. Inclusive of all prescriptions in the drug class for each patient during the year. This measure assumes patients take their entire prescription as directed. See Appendix B6 of the 2021 Tennessee Annual Overdose Report for more information.
Prescription Data Active Prescription Days for Patients Filling Benzodiazepines in TN from 2016-2020* Prescription Days 2016 2017 2018 2019 2020 1-7 days 15.2% 16% 17.4% 19.1% 18.7% 8-30 days 20.3% 20.5% 20.4% 20.2% 20.1% 31-90 days 15.7% 15.4% 15.1% 14.7% 14.4% 91-180 days 13.4% 13.1% 12.8% 12.3% 12.1% 181-270 days 11.4% 11.1% 10.9% 10.5% 10.4% >270 days 24% 23.8% 23.3% 23.2% 24.2% *Analysis conducted by the Office of Informatics and Analytics, TDH. Limited to TN residents. Data Source: Controlled Substance Monitoring Database. Inclusive of all prescriptions in the drug class for each patient during the year. This measure assumes patients take their entire prescription as directed. See Appendix B6 of the 2021 Tennessee Annual Overdose Report for more information.
Prescription Data Active Prescription Days for Patients Filling Benzodiazepines in TN from 2016-2020* Over one-third of patients filling a benzodiazepine prescription had between 1-30 days of active prescription days in 2020 Prescription Days 2016 2017 2018 2019 2020 1-7 days 15.2% 16% 17.4% 19.1% 18.7% From 2016 to 2020, the percent of patients receiving prescriptions over a week to a month remained largely unchanged 8-30 days 20.3% 20.5% 20.4% 20.2% 20.1% 31-90 days 15.7% 15.4% 15.1% 14.7% 14.4% 91-180 days 13.4% 13.1% 12.8% 12.3% 12.1% 181-270 days 11.4% 11.1% 10.9% 10.5% 10.4% The percentage of benzodiazepine patients who filled more than 270 days of benzodiazepines in a year decreased somewhat from 2016 to 2019, but it increased slightly in 2020 >270 days 24% 23.8% 23.3% 23.2% 24.2% *Analysis conducted by the Office of Informatics and Analytics, TDH. Limited to TN residents. Data Source: Controlled Substance Monitoring Database. Inclusive of all prescriptions in the drug class for each patient during the year. This measure assumes patients take their entire prescription as directed. See Appendix B6 of the 2021 Tennessee Annual Overdose Report for more information.
Prescription Data Total MME for Opioids for Pain in TN by Quarter from 2016-2020* *Analysis conducted by the Office of Informatics and Analytics, TDH (last updated January 15, 2021). Limited to TN residents. Data Source: Controlled Substance Monitoring Database.
Prescription Data Total MME for Opioids for Pain in TN by Quarter from 2016-2020* The total MME of opioid prescriptions for pain has fallen from 2016 to the present. In Q1 2016, 1.859 million MME were dispensed and dropped to 956 million by Q4 2020, a 48.6% decrease *Analysis conducted by the Office of Informatics and Analytics, TDH (last updated January 15, 2021). Limited to TN residents. Data Source: Controlled Substance Monitoring Database.
Prescription Data Percent of Patients Dispensed More than 90 Daily MME for Opioids for Pain in TN by Quarter from 2016-2020* *Analysis conducted by the Office of Informatics and Analytics, TDH (last updated January 15, 2021). Limited to TN residents. Data Source: Controlled Substance Monitoring Database.
Prescription Data Percent of Patients Dispensed More than 90 Daily MME for Opioids for Pain in TN by Quarter from 2016-2020* The percentage of patients who received opioid prescriptions for pain that exceeded 90 daily MME per day continues to decline from 2016 to 2020 The percentage of patients receiving 91 to 120 daily MME has decreased *Analysis conducted by the Office of Informatics and Analytics, TDH (last updated January 15, 2021). Limited to TN residents. Data Source: Controlled Substance Monitoring Database.
Prescription Data Patients with Overlapping Opioid and Benzodiazepine Prescriptions in TN from 2016-2020* *Analysis conducted by the Office of Informatics and Analytics, TDH (last updated January 15, 2021). Limited to TN residents. Data Source: Controlled Substance Monitoring Database.
Prescription Data Patients with Overlapping Opioid and Benzodiazepine Prescriptions in TN from 2016-2020* The percentage of patients with an overlapping opioid and benzodiazepine prescription decreased from 2016 to 2020 *Analysis conducted by the Office of Informatics and Analytics, TDH (last updated January 15, 2021). Limited to TN residents. Data Source: Controlled Substance Monitoring Database.
Prescription Data Rate of Multiple Provider Episodes in TN by Half-Year from 2016-2020* *Analysis conducted by the Office of Informatics and Analytics, TDH (last updated January 15, 2021). Limited to TN residents. Data Source: Controlled Substance Monitoring Database.
Prescription Data Rate of Multiple Provider Episodes in TN by Half-Year from 2016-2020* A multiple provider episode2 (MPE) occurs when a patient fills prescriptions from at least 5 prescribers and at least 5 dispensers in a 6 month period The rate of MPEs in TN has rapidly declined over the last 5 years 2The definition for a multiple provider episode is based off of the Center for Disease Control s (CDC s) definition. *Analysis conducted by the Office of Informatics and Analytics, TDH (last updated January 15, 2021). Limited to TN residents. Data Source: Controlled Substance Monitoring Database.