Enhancing Financial Institutions Through Integration Strategies
Explore the imperative role of integration for financial institutions to thrive, as discussed by Mark J. Cvrkel, a Senior Bank Advisor. The session delves into the historical challenges faced, current problems like inconsistent reporting, and proposed goals like establishing risk-based pricing frameworks. Steps towards achieving these goals, integration strategies, scorecard metrics, ALM projections, and risk ratings are also highlighted.

Download Presentation

Please find below an Image/Link to download the presentation.
The content on the website is provided AS IS for your information and personal use only. It may not be sold, licensed, or shared on other websites without obtaining consent from the author. Download presentation by click this link. If you encounter any issues during the download, it is possible that the publisher has removed the file from their server.
E N D
Presentation Transcript
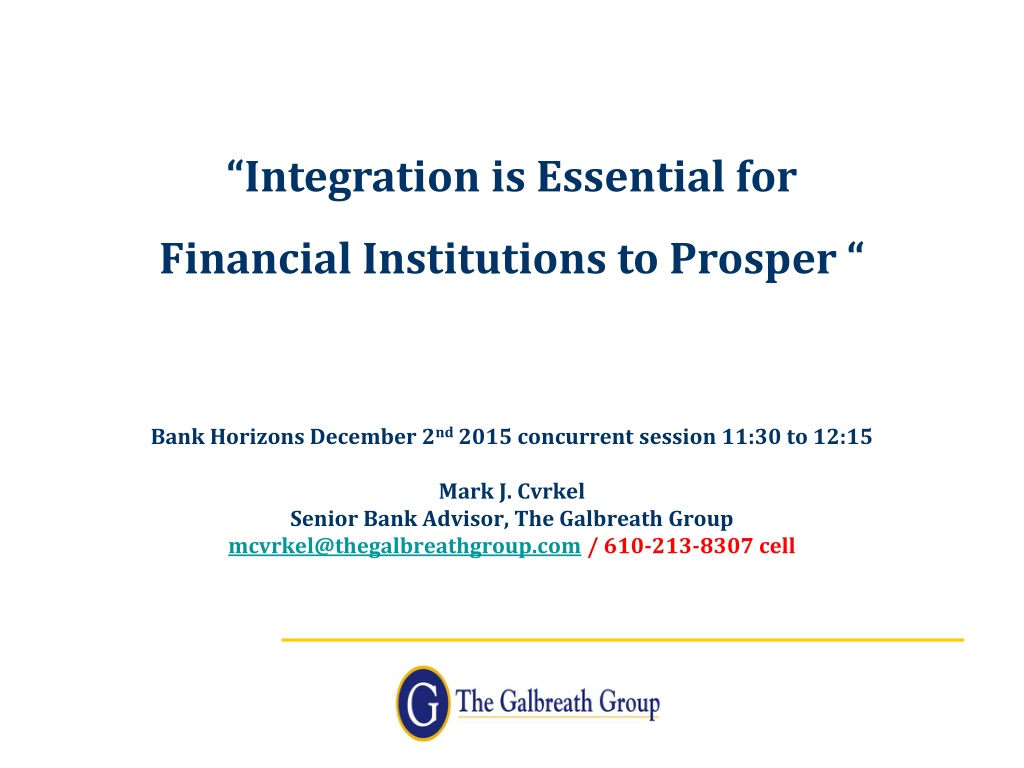
Integration is Essential for Financial Institutions to Prosper Bank Horizons December 2nd2015 concurrent session 11:30 to 12:15 Mark J. Cvrkel Senior Bank Advisor, The Galbreath Group mcvrkel@thegalbreathgroup.com / 610-213-8307 cell
Outline for Discussion: A little Background Some of the Problems Integration Vision Example of Completed Analysis Conclusion Questions? 2
Banks History The organization consisted of 9 separate and distinct banks Consolidated into 3 Banks Consolidated to one bank, but still had THREE DISTINCT REGIONS (remained a silo) 3
Problems: INCONSISTENT Reporting INCONSISTENT Profitability Measurement INCONSISTENT Risk Assessment A SILO APPROACH TO INFORMATION MANAGEMENT 4
GOALS Establish a process which: Outlines a Framework for Risk-Based Pricing Measures Profitability Customer Product Organization Structure Integrated Forward Looking (planning process will be based on profitability contribution & risk metrics) 5
Steps toward accomplishing goals Integrate ALCO and Planning process Re-evaluate Credit Risk Management process: 1. Less subjective 2. Account for concentration risk 3. Maturity and Term structure impacts 4. Correlation between similar borrowers & default Profitability must be a forward looking measurement 6
Scorecard ALM GOALS Stress Testing Planning Process Profitability EconomicCapital 8
ALM Projected Cash flows Prepayment Assumptions Sensitivity Analysis Liquidity What-If MVPE (Market Value of Portfolio Equity) 9
Risk Ratings (Probability of Default - PD) Facility Rating (Loss Given Default LGD) Scorecard Undrawn Lines (Exposure at Default EAD) Add l Factors: Correlation, Concentration Risk, Diversification benefit, & Term Structure(not covered under regulatory capital measurement) Baseline, adverse, & severely adverse scenarios: Real GDP Unemployment Stress Testing CPI Interest rates CRE price index 10
Expected Loss Calculation: Expected losses (EL) ($) = PD (%) * LGD (%) * EAD ($) i.e. risk weighted 5 credit for $100,000 loan: PD=0.50% LGD=40% 0.50% * 40%* $100,000= $200 11
BUFFER RISKS: 1. Market Risk 2. Operation Risk 3. Interest Rate Risk 4. Credit Risk Economic Capital* *capital needed to cover unexpected losses 12
Economic Capital (economic capital addresses all risks from the bank s business activities) 13
Instrument Level Customer Level Product Level Region Level Division Level Profitability 14
Strategic Outlook Annual Plan Rolling 24 Month Outlook Spread & Return Driven Planning Process 15
GOAL Framework for Pricing (Relationship) Performance Measurement Tool for establishing risk appetite Incentive Compensation RAROC (Risk Adjusted Return on Capital) 16
Scorecard ALM GOALS Stress Testing Planning Process Profitability EconomicCapital 17
Example of the process: Region 1 Business / Commercial loans 1201 customers Total outstanding balance of $750MM Average customer balance of $630K Largest customer balance of $28MM Target hurdle rate 10% 19
Commercial and Industrial segment has a Risk-Adjusted Return on Capital (RAROC) of 20.7% 100% of profits come from 14% of customers Potential of making additional 20% of profit 20% of customers are destroying shareholder value CUMULATIVE % OF PROFITS Customers in (A) are highly profitable and provide good margins on their loans Customers in (B) give minimal economic profit but add to loan volume Customers in (C) are destroying value and should be re-priced or avoided 140% 120% 100% 80% 60% A B C 40% 20% 0% CUMULATIVE % OF ACCOUNTS 0% 20% 40% 60% 80% 100% 20
RAROC as a standard unit on the customer level to measure profitability Risk Net Income (Margin) Funds Transfer Pricing Interest Income Cost of Funding Fee Income Expected Loss Risk Rating Reward PD LGD Cost Allocation Operational Costs Economic Capital Cost of Capital Taxes Economic Profit * Margin Operational Costs Expected Loss Taxes RAROC= Economic Capital * Economic profit of $0 is required to meet hurdle, which is equivalent to a RAROC of 10% 21
High risk customers can be priced with a higher margin to compensate for the risk Customer 1 - RR7 Customer 2 - RR7 Customer 3 - RR7 Customer 4 - RR10 Customer 5 - RR14 Customer 6 - RR7 Low High Low High Low High Low High Low High Low High High High High High High High Customer Metrics Maximize Maximize Maximize Maximize Maximize Maximize Low Low Low Low Low Low Avoid Avoid Avoid Avoid Avoid Avoid Loan Exposure Interest Income (%) Interest Income * Cost of Funds (%) ** Margin Net Interest Income PIT PD (%) LGD (%) Expected Loss (%) Expected Loss Non-Interest Income Non-Interest Expense Net Non-Interest Income Earnings Before Income Taxes Income Tax Provision Earnings After Income Taxes ROA Economic Capital (%) Economic Capital Hurdle Rate Cost of Capital RAROC Economic Profit 264,982 6.40% 16,971 2.07% 4.34% 11,492 1.79% 27.5% 0.49% (1,307) 129 (1,024) (895) 9,290 (3,252) 6,039 2.28% 10.44% 27,668 1,169,742 7.17% 83,903 4.27% 2.90% 33,963 1.85% 26.1% 0.48% (5,646) 1,358,621 6.40% 86,956 4.88% 1.52% 20,612 1.79% 27.5% 0.49% (6,702) 2,181,087 6.15% 134,029 4.71% 1.44% 31,356 6.06% 25.0% 1.52% (33,054) 280,818 7.54% 21,161 2.39% 5.15% 14,461 11.80% 25.0% 2.95% (8,287) 166 (1,649) (1,484) 4,691 (1,642) 3,049 1.09% 12.65% 35,529 1,232,496 7.02% 86,554 4.53% 2.50% 30,782 1.79% 27.5% 0.49% (6,080) - - - - (3,072) (3,072) 25,245 (8,836) 16,409 1.40% 5.77% 67,533 10% (6,753) 24.30% 9,656 (3,014) (3,014) 10,896 (3,814) 7,082 0.52% 16.13% 219,176 (4,690) (4,690) (6,388) 2,236 (4,152) -0.19% 11.00% 239,829 (2,572) (2,572) 22,130 (7,746) 14,385 1.17% 13.84% 170,596 10% 10% 10% 10% 10% (2,767) 21.83% 3,272 (21,918) 3.23% (14,835) (23,983) -1.73% (28,135) (3,553) 8.58% (504) (17,060) 8.43% (2,675) High Risk/ High Reward High Reward/Low Risk Low Reward/ Low risk Low Reward/Low Risk * Interest income includes funds sold and bought ** Cost of funds adjusted for economic capital 22
High leverage, low profitability, and slow growth contributed to increased risk Loan 6 (Risk Rating 8) Loan 5 (Risk Rating 14) Loan 6 (Risk Rating 8) Loan 5 (Risk Rating 14) Customer 5 Risk Rating 14 Customer 6 Risk Rating 7 Total Debt to Total Assets ROA Quick Ratio 30% 20% 35% 30% 25% 15% 25% 20% 20% PD PD PD 15% 10% 15% 10% 10% 5% 5% 5% 0% 0% 0% 0% 50% 100% 0% 50% 100% 0% 50% 100% Percentile Percentile Percentile Working Capital Growth Current Liabilities to Sales 25% Sales Growth 20% 14% 12% 20% 15% 10% 15% 8% PD PD PD 10% 6% 10% 4% 5% 5% 2% 0% 0% 0% 0% 50% 100% 0% 50% 100% 0% 50% 100% Percentile Percentile Percentile 23
Pricing levers can be used to increase profitability of customer Customer 5 - RR14 Low Increase Annual Fee Income by $775 Maintain a Deposit Account of $78k Annual Renewal Option by the Bank High Raise Lending Rate by 28bps Add 13% of Cash Collateral High Customer Metrics Maximize Low Avoid Loan Exposure Interest Income (%) Interest Income * Cost of Funds (%) ** Margin Deposit Amount Deposit Credit(%) Deposit Credit Net Interest Income PIT PD (%) LGD (%) Expected Loss (%) Expected Loss Non-Interest Income Non-Interest Expense Net Non-Interest Income Earnings Before Income Taxes Income Tax Provision Earnings After Income Taxes ROA Economic Capital (%) Economic Capital Hurdle Rate Cost of Capital RAROC Economic Profit 280,818 7.54% 21,161 2.39% 5.15% 280,818 7.81% 21,936 2.39% 5.43% 280,818 7.54% 21,161 2.39% 5.15% 280,818 7.54% 21,161 2.39% 5.43% 77,535 1.00% 775 15,237 11.80% 25.0% 2.95% (8,287) 166 (1,649) (1,484) 5,466 (1,913) 3,553 1.27% 12.65% 35,529 280,818 7.54% 21,161 2.39% 5.15% 280,818 7.54% 21,161 2.45% 5.08% - - - - - - - - - - - - - - - 14,461 11.80% 25.0% 2.95% (8,287) 166 (1,649) (1,484) 4,691 (1,642) 3,049 1.09% 12.65% 35,529 10% (3,553) 8.58% (504) 15,237 11.80% 25.0% 2.95% (8,287) 166 (1,649) (1,484) 5,466 (1,913) 3,553 1.27% 12.65% 35,529 10% (3,553) 10.00% 14,461 11.80% 25.0% 2.95% (8,287) 941 (1,649) (708) 5,466 (1,913) 3,553 1.27% 12.65% 35,529 10% (3,553) 10.00% 14,458 11.80% 22.7% 2.68% (7,525) 166 (1,649) (1,484) 5,450 (1,907) 3,542 1.26% 12.61% 35,423 10% (3,542) 10.00% 14,268 11.80% 25.0% 2.95% (8,287) 166 (1,649) (1,484) 4,497 (1,574) 2,923 1.04% 10.13% 28,450 10% (2,845) 10.27% 10% (3,553) 10.00% 0 0 0 0 78 24
Targeting low-risk customers allows the bank to price more competitively relative to market Customer 1 - RR7 Low Customer 2 - RR7 Low High High Lower Rate by 190bps Lower Rate by 127bps High High Maximize Maximize Customer Metrics Low Low Avoid Avoid Loan Exposure Interest Income (%) Interest Income * Cost of Funds (%) ** Margin Net Interest Income PIT PD (%) LGD (%) Expected Loss (%) Expected Loss Non-Interest Income Non-Interest Expense Net Non-Interest Income Earnings Before Income Taxes Income Tax Provision Earnings After Income Taxes ROA Economic Capital (%) Economic Capital Hurdle Rate Cost of Capital RAROC Economic Profit 264,982 6.40% 16,971 2.07% 4.34% 11,492 1.79% 27.5% 0.49% (1,307) 129 (1,024) (895) 9,290 (3,252) 6,039 2.28% 10.44% 27,668 264,982 4.50% 11,937 2.07% 2.44% 6,458 1.79% 27.5% 0.49% (1,307) 129 (1,024) (895) 4,257 (1,490) 2,767 1.04% 10.44% 27,668 1,169,742 7.17% 83,903 4.27% 2.90% 33,963 1.85% 26.1% 0.48% (5,646) 1,169,742 5.90% 69,047 4.27% 1.63% 19,108 1.85% 26.1% 0.48% (5,646) - - (3,072) (3,072) 25,245 (8,836) 16,409 1.40% 5.77% 67,533 10% (6,753) 24.30% 9,656 (3,072) (3,072) 10,390 (3,636) 6,753 0.58% 5.77% 67,533 10% (6,753) 10.00% 10% 10% (2,767) 21.83% 3,272 (2,767) 10.00% 0 0 25
Thoughts: Do not underestimate the time frame to implement the scorecard project A scorecard approach will aid in the implementation of FASB Current Expected Credit Loss Impairment Model (CECL) Do not underestimate required IT resources including a dedicated person Scorecard progress will be hindered by incomplete source data in loan system and lack of dedicated project team (CECL issue also) It will be a Management Challenge adjusting from volume-driven perspective to profitability perspective 26
Regulator Perspective Continued regulatory pressure will be the norm ALL BANKS Capital will need to be allocated by product line (dual approach) Management and Board will need to set risk appetite even at smaller institutions Provisioning will be data driven and forward looking (CECL) M&A activity will increase 27
Pricing to the Competition Be willing to walk Understand the competition Never lower pricing spreads without gaining something for your organization You are building long term relationships - customers understand that you need to make MONEY You will not win all the deals KEEP IT SIMPLE 28


")