Leveraging Vehicle-Based Safety Technology for Curtailing Distracted Driving
Perdue's private fleet employs various vehicle-based safety technologies to combat distracted driving, including video technology and mobile device interventions. The hierarchy of controls is discussed, covering strategies like substitution, engineering controls, and collision avoidance systems. By implementing these measures, fleets can enhance safety and minimize distractions on the road.

Download Presentation

Please find below an Image/Link to download the presentation.
The content on the website is provided AS IS for your information and personal use only. It may not be sold, licensed, or shared on other websites without obtaining consent from the author. Download presentation by click this link. If you encounter any issues during the download, it is possible that the publisher has removed the file from their server.
E N D
Presentation Transcript
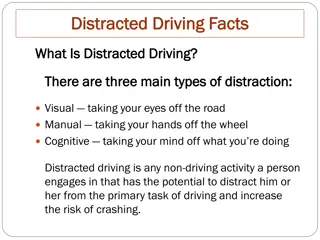
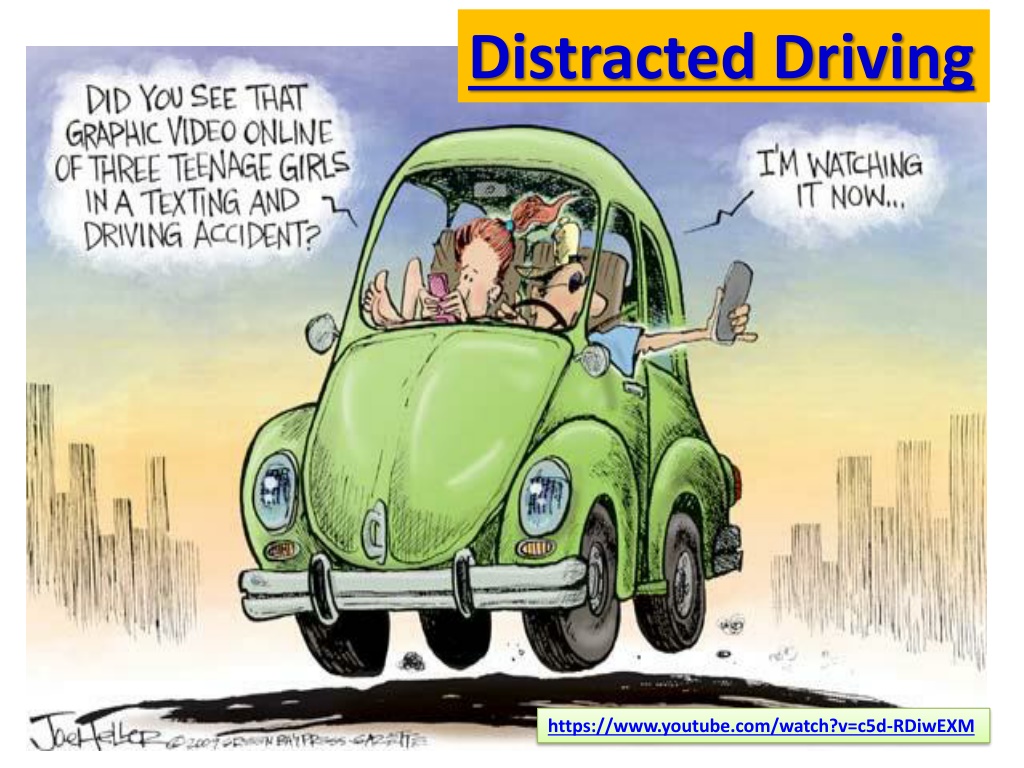
Distracted Driving https://www.youtube.com/watch?v=c5d-RDiwEXM
Leveraging Vehicle Based Safety Technology to Curb Distracted Driving Frank J. Cruice, CSP, CRSP, CHCM Sr. Dir. Corp. Safety/Security Thomas E. Pollard, CTP, CDS, CDT Director Fleet Safety
Perdues Private Fleet 680 Power Units, 70 Straight Trucks , 1900 Trailers 650 drivers 615 Non-Commercial vehicles, VMT, 37 MM Commercial / 11MM Non-Commercial. Our entire commercial fleet has Vehicle Based Video Technology . We also strategically use a host of other vehicle based safety technology. Videos for PPT\EWT21067 ACC .dce
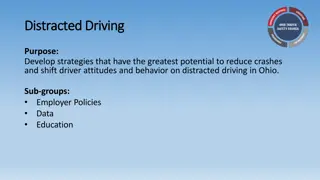
Hierarchy of Controls of Distracted Driving ELIMATION Fleet Utilization Increase payload Equipment specification State Legislating Agencies
SUBSTITUTION Mobile Device Cradles / Docking Stations Intervention for repeated offenders You ll Need to Plug-in Your Smartphone To Start the Truck Videos for PPT\168728 Cell Ph .dce Hierarchy of Controls of Distracted Driving
Engineering Controls Speed Governance / Speed Limiting Short haul fleet = 58 MPH Over the road fleet = 62 MPH Vehicle Stability Controls Roll stability truck and trailer Auto-Shift Hands on wheel Less cognitive process Less fatigue Hierarchy of Controls of Distracted Driving
Hierarchy of Controls of Distracted Driving Engineering Controls Low Center of Gravity Vehicle visibility & lighting
Hierarchy of Controls of Distracted Driving Engineering Controls Collision Avoidance (FWD Radar; Lane Departure & Blindside) Alert for slower or stopped vehicles ahead See through fog and alert to vehicles ahead See and alert for unintentional lane drift / departure Videos for PPT\FDW80375 FWD .dce Videos for PPT\ESM90181 FWD Glare.dce Videos for PPT\FDA78734 Lane Depart .dce
ADMINSTRATIVE CONTROLS Coach the Driver via Event (ERDs) Training on Distracted Driving Driver Meetings Media Releases/Newsletters Policies & SOPs to include driver accountabilities Cornering Policy 10 MPH Below the Advanced Warning 35 MPH 50 - 37 MPH Hierarchy of Controls of Distracted Driving
Hierarchy of Controls of Distracted Driving PPE Proximity Controls Less or no Reaching . Seat Belts Creating the Visual Standard Seat Belt Chimes Blue Tooth Technology Hands Free noise cancelling Active intervention Adaptive cruise control Active visual and audible alerts Videos for PPT\FDF03695 Active FWD .dce Fatigue reducing seats Lumbar and side support Protect Driver and Company Frivolous actions Videos for PPT\EZF18314 ACC Intersect .dce Videos for PPT\EWT21067 ACC .dce
Vehicle Based Vehicle Based Behavioral Behavioral Safety Safety Vehicle Mounted Safety Technology
Distracted Driving Vehicle Based Safety Systems Know what you want to achieve Driver Behavior management? Maintain compliance with changing rules & regs? Reduce accidents and risk exposure to litigation? Action based improvement required by insurance? Reduce the cost of accidents? Driver acceptance to add technology
Does it give you the data you need? Does it give you the data you need? Total Distractive Activity 2014 - 2016 Near Collision From a Distracting Event by Year 458, 46% 542, 54% 25 Near Collision 20 15 Uneventful Coachable 10 5 0 2014 2015 2016 120 Distraction by Type and Year Near Collision 100 10 20 7 80 60 40 20 Action Items 0 2014 20 15 68 2015 44 38 105 2016 48 42 78 Increase accountability for Cell Phone (24%) Focus on drivers who repeat behaviors (13%) Near Collision IRB Review (required) Cell Phone Food Drink Other
Does it Bring Value? Does it Bring Value? Commercial Highway Crashes 400 Total Highway Cases by Class, Commercial vs., Non-Commercial 350 300 250 Size of Commercial Fleet 200 150 Avg. # PWR Units 650 100 50 Avg. Miles 37 MM 0 FY09 FY10 FY11 FY12 FY13 FY14 FY15 FY16 FY17 339 304 352 336 283 258 243 293 288 221 170 85 90 76 74 81 61 59 48 62 49 20 25 16 17 Total Cases Commercial Commercial HWY Non-Commercial Non-Commercial HWY 285 233 83 52 21 317 200 58 66 15 277 218 73 59 14 124 98 33 26 8
Does it make sense? Does it make sense? Crashes Arising From Distracted Driving 10 Year Trend (CMV) 35 Percent of Total Crashes Attributed to Distracted Behavior (CMV) 30 25 70% 20 60% 15 50% 10 40% 5 30% 0 20% 2007 2008 2009 2010 2011 2012 2013 2014 2015 2016 10% Frequency 30 17 30 19 11 5 6 4 3 3 0% 2009 2010 2011 2012 2013 2014 2015 2016 Percent 60% 66% 35% 20% 17% 13% 12% 15% 80 70 Total Highway Cases by Class, Commercial vs, Non-Commercial) 60 50 40 30 20 10 0 FY09 FY10 FY11 FY12 FY13 FY14 FY15 FY16 FY17 Chargeable Highway 72 37 38 32 48 38 30 25 11 Chargeable Highway Commercial Chargeable Highway Non- Commercial 50 29 31 25 36 30 25 20 8 22 8 7 7 12 8 5 5 3
Does it reduce management time? Does it reduce management time? In Cab Camera Speed limiters Roll Stability Lower Center of Gravity Single Vehicle Roll Over reduction. Total Rollover - 88 (FY07 FY16) 16 16 12 11 10 7 7 4 3 2
Does it reduce risk exposure? Does it reduce risk exposure? 35 Over the Road Trucks Approx, 225 Began Rollout 2010 with out 2011 Models. 30 30 26 Crash Frequency Crash Frequency Fleet completion about 95% 25 21 18 20 ERA95293.dce Axis Title 13 15 BSWS & LDWS 11 11 10 FWD Radar 5 4 4 LDWS 3 5 2 2 2 2 2 1 1 1 1 0 0 2010 2011 2012 2013 2014 2015 2016 Merge / Sideswipe Same Dir. (Any, preventable or not) Rear End (#1 striking #2) Run Off Road 21 30 26 11 18 13 11 4 2 2 1 1 1 5 0 2 2 2 1 3 4 19
Truck Mounted Event Recorder Continuous Improvement
The Journey to a New Beginning In 2008 we needed an intervention crashes of large trucks at one of our locations. That need has led us on a journey of continuous improvement of driver behavior. One part of our strategy was the use of video. What we found is, Video motivates and drives change . Seeing the actions of motorists leads to self improvement. Senior management to the front line supervisor now have believable data to better manage drivers and vehicles. Seeing is Believing
Driver Acceptance Driver Acceptance Driver acceptance is critical. Management engagement / ownership is critical Managers and Drivers will understand if you; Show Why Show it is current with today s technologies Show that upper management is committed to the process Show that it is part of your overall strategy Show it will build accountability from management to driver Explain how it works When you see behavior; How you react will determine how your drivers respond Show that the process adds value
Manager Acceptance Coaching & Intervention will influence driver improvement. Coaching / Consequences, change behavior. Management workload decreases as behaviors change. Accident case management time decreases drastically. Threshold of Enforcement 37 Cameras, about 50 Drivers
Adding Value to your, Adding Value to your, Case Management Process Case Management Process Vehicle Mounted Camera Process Eliminate the guess work. Previously we spent over 80% of our energy reaching agreement on what happened, and less than 20% on preventing re-occurrence. Now we see what happened and we get closure very quickly. Now we spend most all of our time on preventing re-occurrence. Create a level platform: By paralleling the Truck Camera process with Defensive Driving education, we eliminate the barrier between the Transportation Supervisor and driver. Coach, using defensive driving strategies Coaches and drivers now use the common language of DDC. Coaches and drivers alike learn by engaging in the process.
Lessons Learned Lessons Learned No matter what technology you choose consider the following; Train managers so they deliver effective coaching. (Annual Refresher). (Coach to Defensive Driving) Don t get stale (revitalize) Add to your deliverables and find continuous ways to improve. Check and keep process integrity. Seek Continuous Improvement on deliverables. Every couple years compare the process and service. Networking with industry. (NPTC, ATA, ASSE, MATS, Etc.) Create Visual Standards to associates and motoring public alike. Use the PIP (Performance or Driver Improvement Process) to improve driver behavior. Avoid the negative impact of Discipline Focus Behavioral Management on Repeated Behaviors
Questions,,, &@$&@$Q@&^ Thank you for your time.