Understanding Independent and Dependent Quantities in Graphical Representation

Explore the concepts of independent and dependent quantities through examples such as an endangered species project and a commuter flight scenario. Learn how to identify and represent these quantities graphically to deepen understanding. Engage in activities like jigsaw puzzles and matching graphs to reinforce learning.
- Graphical Representation
- Independent Variables
- Dependent Variables
- Educational Activities
- Quantitative Relationships

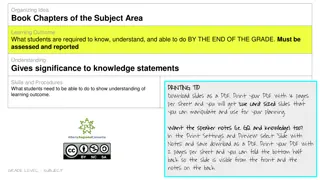
Download Presentation

Please find below an Image/Link to download the presentation.
The content on the website is provided AS IS for your information and personal use only. It may not be sold, licensed, or shared on other websites without obtaining consent from the author. Download presentation by click this link. If you encounter any issues during the download, it is possible that the publisher has removed the file from their server.
E N D
Presentation Transcript
Warm Up: 1/11 1. What does it mean for something to be independent? 2. What does it mean for something is dependent?
January 11th, 2017 Agenda: Warm Up (10) Independent/Dependent (15) Jigsaw (30) Cut and Paste (20) Exit Slip (10 min) Essential Question: How are independent and dependent quantities represented graphically?
Workbooks: Grab a book from bookshelf at the back of the room. Write your name on the spine using a Sharpie. Open to pg. 4 Sit quietly and wait for further instructions.
Pg. 4 Independent/Dependent:
Endangered Species: The Elkwood Aquatic Society is working with various reptile species to increase their populations. In their latest effort, the initial population of 450 endangered turtles tripled each year for the past five years. Independent: Time (years) Dependent: Population (turtles)
Commuter Flight: A commuter flight between two cities in Oregon takes about 40 minutes. The plane will increase its altitude for the first half of the flight until it gets to 18,000 feet, and then it will descend for the second half of the flight. The plane ascends and descends at a constant rate of 900 feet per minute. Independent: Time (minutes) Dependent: Altitude (feet)
Jigsaw: Each pair gets two scenarios. Identify the independent and dependent quantities (include units) Person B, raise your hand when your pair has finished.
Matching Graphs: Cut out graphs on pg. 11 and pg. 13. Get a glue stick from the blue pouch on the wall.
Matching Graphs: Match the 8 graphs with their scenario. Hint: Think of patterns in movement both in the scenario and in the graph.
Homework: Signed Syllabus Due Tomorrow (1/12) Bring course materials!
Exit Slip: 1. Identify the independent and dependent quantities for the problem situation. Gillian is playing video games at an arcade. Gillian starts with $40 and is playing games that cost 50 cents per game. 2. Which of the following graphs would best represent the situation. Explain your choice. Homework: Syllabus and worksheet 1 2 3