Understanding Pharmacology: Introduction to Neurotransmitters and Nervous System
This content delves into the fundamentals of neuropharmacology, exploring concepts such as dose-response curves, afferent and efferent neurons, peripheral nervous system divisions, neurotransmitter functions, and neurochemical classifications. It covers the roles of cholinergic, adrenergic, and dopaminergic systems in regulating different physiological responses, shedding light on the intricate workings of the nervous system.

Download Presentation

Please find below an Image/Link to download the presentation.
The content on the website is provided AS IS for your information and personal use only. It may not be sold, licensed, or shared on other websites without obtaining consent from the author. Download presentation by click this link. If you encounter any issues during the download, it is possible that the publisher has removed the file from their server.
E N D
Presentation Transcript
PHL. 313 Dr. Khairy Zoheir 1
Lab.1 INTRODUCTION TO NS PHARMACOLOGY and DOSE- RESPONSE CURVE
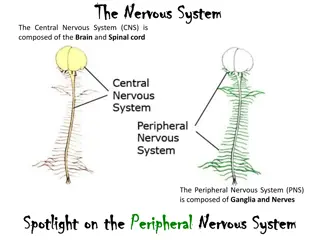
Nervous System Central Nervous System Peripheral Nervous System Brain stem Afferent Sensory division Efferent Autonomic Cerebrum Spinal cord Somatic 3
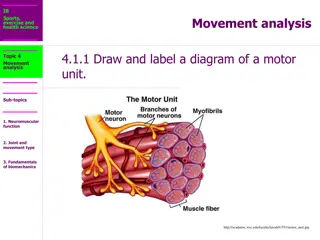
Afferent and efferent neurons Afferent is known as sensory or receptor neurons which carry nerve impulses from receptors or sense organs toward the central nervous system. Efferent is known as motor or effector neurons which carry nerve impulses away from the central nervous system to effectors such as muscles or glands 4
The Peripheral Nervous System Efferent nervous system Somatic nervous system Autonomic nervous system (voluntary) (involuntary) Skeletal muscle Heart, blood vessels, glands, other visceral organs, smooth muscle 5
Anatomic classification 1- sympathetic(fight and flight) To maintain homeostasis 6
2- Parasympathetic (rest and digest) Its actions can be summarized as "rest and digest", as opposed to the "fight-or-flight" effects of the sympathetic nervous system.. 7
Neurotransmitter: A chemical that transmits signals from one neuron to another or from a neuron to an effector cell. Chemical (intracellular messengers) Electrical Chemical Physiological Stimulation (neurotransmitter) functions (impulse) Electrical (membrane ion channels) 8
Neurotransmitter-based classification 1- Cholinergic, 2- Adrenergic, and 3- Dopaminergic 9
1- Cholinergic transmitter It means related to the neurotransmitter Acetylcholine. The parasympathetic nervous system is entirely cholinergic. Neuromuscular junctions, preganglionic neurons of the sympathetic nervous system, and the sweat glands 10
Definition of Agonist and Antagonist Agonist: A structural analog that is capable of stimulating a biological response. Antagonist: A receptor-specific blocker (e.g., enzyme inhibitor) or a physiologic agent (e.g., hormone), that prevents the action of another molecule. 12
Mode of Action Direct-acting: Molecule that physically binds to the target for its effect. Example: ACh activates cholinergic receptors. Indirect-acting: Molecule that exerts effect on the target by interacting with another molecule. Example:neostigmine blocks AchE, causing Ach accumulation. 14
Acetylcholine (ACh) Cholinergic neurotransmitter. Parasympathomimetic. Muscarinic action.(M3) Sites of release: Preganglionic synapses of both sympathetic and parasympathetic ganglia. Parasympathetic postganglionic neuroeffector junctions. All somatic motor end-plates on skeletal muscles.
Muscarinic Autonomic Effects of Ach Affect on gatsrtointestinal tract (GIT) as follow 1- Motility (Increase contraction) 2- Secretion (increase) 3- Sphincters (relaxation) 17
Muscarinic Actions The Muscarinic Actions -- Similar to those of parasympathetic stimulation (M1): CNS, PNS, gastric parietal cells (M2): conducting tissue (M3): exocrine glands; smooth muscle 18
Action of acetylcholine on smooth muscle. Contraction of smooth muscle by acetylcholine is mediated by activation of muscarinic receptors M2 and M3 subtypes. Acetylcholine (ACh) has virtually no systemic therapeutic applications because its actions are diffuse, and its hydrolysis, catalyzed by both acetylcholinesterase (AChE) and plasma butyrylcholinesterase, is rapid. 19
Tyroide Apparatus Solution NaCl: Isotenicity physiogragh CaCl2: Contraction of muscle H2O Glucose: Energy NaHCO3: valve 25 ml PH MgCL2: Intestine part relaxation Valve Oxygen supply (Wash) 21
Why Tryroid Solution: 1- To maintain the muscle alive throughout the experiment. 2- To maintain the same environmental condition for the cells inside the animal (In vivo) as outside the animal (In vitro).
Why small intestine? 1- Easy handling in the lab. 2- Good model to study the effects of cholinergic drugs. 3- Longitudinal muscle of guinea pig intestine contains muscarinic receptors of which M2 and M3 subtypes. 23
Definition of dose- response curve: It is a relationship between dose & response which describes the change in effect on an organ caused by differing levels of exposure (or doses) to a stressor (usually a chemical) after a certain exposure time.
Dose Response Curve It is a relationship between Dose and (Response %) From this curve we can see : Potency (a measure of the activity of a drug in a biological system) Efficacy (the capacity to produce an effect) Therapeutic index (dose of a drug for 50% of the population divided by the minimum effective dose for 50% of the population ED50 :dose in pharmacology is the amount of drug that produces a therapeutic response in 50% of the people taking it 25
Procedure 1- Cut 1 Cm from Guine pig small intestine and hang it in the organ bath which has tyroid solution. 2- Use MP36 to measure the contraction of the intestine inside the organ bath. 3- Add 0.1 ml Acetylcholine (Ach) (0.1 %) to the intestine which in the organ bath and record the response then stop the MP36 and make washing for the tyroid in the organ bath. 4- Add 0.2 ml of Ach and record the response and then wash. 3- Add 0.4, 0.8, 1.6,>>>>. Till get maximum response for the contraction of the intestine as showing in next slide. 4- Tabulate the relationship between the dose and response (cm) and % of response . 5- Make histogram between the dose and % response to get ED50 as shown .
Dose Response Curve D + R DR complex Response wash cm 0.1ml 0.2ml 0.4ml 0.8ml 1.6ml 27
Dose Response Curve Dose (ml) Response (cm) Response % (x/ max )*100 33.3 0.1 1 0.2 1.8 60 0.4 2.5 83.3 0.8 3 100 1.6 3 100 28


")


")