Education Sector Review: Data Insights and Trends (2019-2024)
Exploring data on literacy rates, completion rates, out-of-school children, early childhood education, and foundational learning skills among youth in Sindh from 2018-2019. The analysis covers urban-rural disparities, gender variations, and educational attainment across different wealth quintiles.

Download Presentation

Please find below an Image/Link to download the presentation.
The content on the website is provided AS IS for your information and personal use only. It may not be sold, licensed, or shared on other websites without obtaining consent from the author. Download presentation by click this link. If you encounter any issues during the download, it is possible that the publisher has removed the file from their server.
E N D
Presentation Transcript
Situation / Data Analysis Joint Education Sector Review SESP&R (2019-2024)
Literacy rates among youth aged 15 to 24 years (Sindh MICS Literacy rates among youth aged 15 to 24 years (Sindh MICS 2018 2018- -19) 19) 70 61 52 48 31 Total Male Female Urban Rural Sex Area 90 72 49 37 28 13 2 None/Preschool Primary Poorest Second Middle Fourth Richest Highest level of education attained Wealth quintile
Completion Rates (Sindh MICS 2018 Completion Rates (Sindh MICS 2018- -19) 19) 49 45 43 42 40 38 37 35 31 24 22 19 Primary Middle High / Secondary Higher Secondary Total Male Female Linear (Total) Geographic Disaggregation (Rural Urban) Wealth Quintiles (Poorest Richest) 100 82 76 71 80 62 49 55 60 48 40 30 11 29 13 23 9 7 4 20 18 0 Primary Middle High / Secondary Higher Secondary Primary Middle High / Secondary Higher Secondary Urban Rural Poorest Richest
Out of School Children (Sindh MICS 2018 Out of School Children (Sindh MICS 2018- -19) 19) 66 60 58 51 50 49 47 43 41 40 38 34 Primary Middle High / Secondary Higher Secondary Total Male Female Linear (Total) Geographic Disaggregation (Rural Urban) Wealth Quintiles (Poorest Richest) 72 86 65 79 72 57 71 55 45 35 27 27 27 15 9 9 Primary Middle High / Secondary Higher Secondary Primary Middle High / Secondary Higher Secondary Urban Rural Poorest Richest
Early Childhood Education (Sindh MICS 2018 Early Childhood Education (Sindh MICS 2018- -19) 19) Percentage of children age 36-59 months attending early childhood education 18 15 11 10 10 6 4 Male Female Urban Rural 3 4 Total Sex Area Age
Share of children aged 7 to 14 with foundational learning skills Share of children aged 7 to 14 with foundational learning skills (Sindh MICS 2018 (Sindh MICS 2018- -19) 19) 26 25 19 18 20 16 15 10 10 6 4 4 4 5 1 0 Urban Rural Male Female Area Total Gender 63 62 62 50 43 36 25 21 16 14 12 8 7 7 6 5 4 3 3 1 Grade 1 Grade 2 Grade 3 Grade 4 Grade 5 Grade 6 Grade 7 Grade 8 Grade 9 Grade 10 Primary Middle school High/Secondary school Reading Numeracy
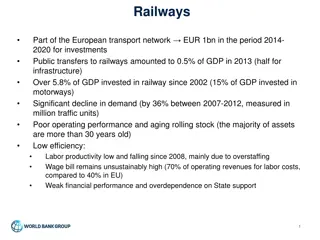
Finance Spending on Education & Financial Management Provincial Education Expenditure as %age of Provincial GDP 1.71% 1.63% Access to Education 1.52% 1.46% 1.46% 2016-17 2017-18 2018-19 2019-20 2020-21 Education Expenditure as %age of Provincial GDP Source: Audited Financial Statements, State Bank of Pakistan Spending on education is low (less than 2% of GDP), international recommendation is 4% Recurring resources: Bulk of the expenditure has been on employee-related expenses Low funds available for development (ADP/schemes)
Finance Spending on Education & Financial Management Education Expenditure as a %age of Total Provincial Expenditure Access to Education 19% 15% 16% 16% 18% Education Expenditure Other Expenditures 85% 84% 84% 82% 81% 2014-15 2015-16 2016-17 2017-18 2018-19 Source: Finance Department, Government of Sindh
Data and Monitoring helps! Performance on Key School Monitoring Indicators 99.9% 97% Access to Education 70% 67% 60% 56% 10% 7% 4.9% 3% School Coverage Open Schools Absconder Teachers Habitual Absentee Teachers Student Attendance M&E Report 2019-20 M&E Report 2020-21 Source: DG M&E, SE&LD 3% increase in opening schools during this term 2% decrease in absconder teachers
Level attending by Age (Sindh MICS 2018 Level attending by Age (Sindh MICS 2018- -19) 19) 1 1 1 1 3 3 4 7 6 8 11 10 16 18 18 16 21 20 32 28 20 28 8 45 15 29 52 3 1 54 17 30 11 6 47 2 36 4 22 7 22 13 15 94 9 83 5 71 66 61 57 53 52 47 47 45 42 42 40 38 37 2 3 4 5 6 7 8 9 10 11 12 13 14 15 16 17 Out of school Preschool Primary Middle school Secondary school Higher
Out-of-School Children (PSLM and ASER) Percentage Out-of-School Children aged 5-16 Years Access to Education 51 49 44 42 40 37 36 34 33 30 27 25 Male Female Total Male Female Total Sindh Pakistan 2013-14 2018-19 Source: PSLM Report, Pakistan Bureau of Statistics Source: ASER Report 2016 Overall, OOSC rate has decreased in Sindh from 2014 to 2019 Out of every 100 children: 43 are OOS at Primary level 44 are OOS at Secondary level
Early Childhood Education (Sindh MICS 2018 Early Childhood Education (Sindh MICS 2018- -19) 19) Percentage of children age 36-59 months attending early childhood education 18 15 11 10 10 6 4 Male Female Urban Rural 3 4 Total Sex Area Age Level of education attended by age 1 7 18 16 32 27 30 22 83 66 52 46 3 4 5 6 Out of school Preschool Primary
Learning Achievement (Grade 3) - ASER ASER Reports - Learning Achievement Comparison (%) for Class 3 Children (language/literacy and Mathematics) - Sindh Rural 50 44 Improvement from 2016 to 2018 32% of Grade 3 children can read a sentence in 40 36 32.3 30 Urdu/Sindhi 36% can read a word in English 44% can do simple subtraction 16.2 20 15.4 14.5 10 0 Who can read sentence (Urdu//Sindhi) Who can read word (English) Who can do subtraction 2018 2016 Source: ASER reports 2016 and 2018 Sindh section
Availability of Government Schools in Sindh (Sindh ASC 2019 & 2020) Government Schools- Sindh 90% of all government schools are primary Access to Education Sheer drop in supply of government schools: from 90% primary schools, to less than 6% middle/elementary schools 4% Secondary schools 1% Higher secondary schools 44,569 44,296 1,930 1,778 1,895 1,777 851 318 817 318 Primary Middle Elementary Secondary H. Secondary ASC 2019 ASC 2020-21 Source: Annual School Census


")

 - ASER")