Annual Performance Plan 2023/24 for Basic Education Sector
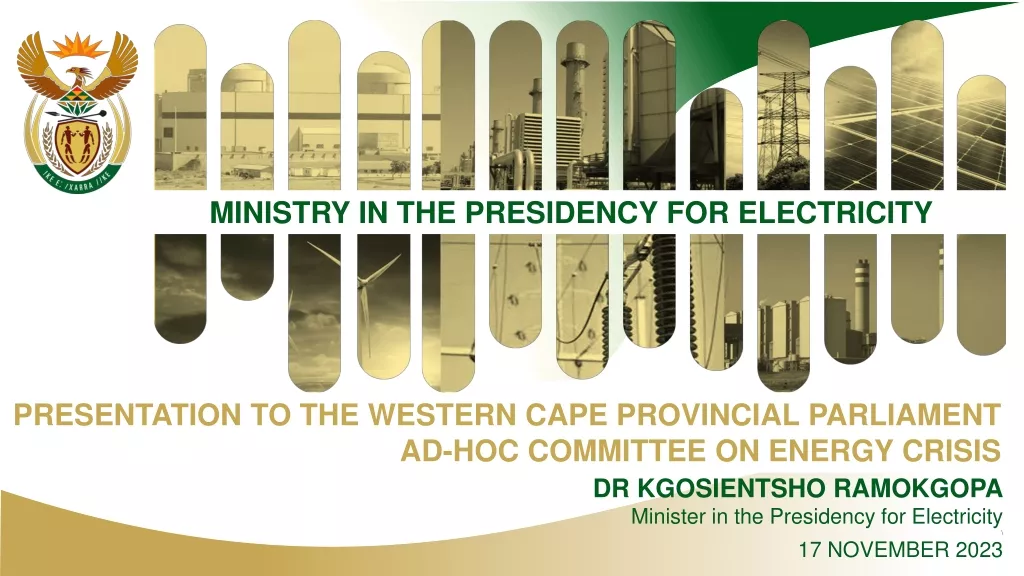
The Annual Performance Plan 2023/24 for the Basic Education sector outlines strategic priorities, government initiatives, and progress towards educational goals aligned with the National Development Plan. The presentation covers key areas such as sector size, educational system structure, language distribution, and budget allocation, aiming to enhance learning outcomes and instructional effectiveness. Through evidence-based strategies and oversight, the Department of Basic Education seeks to implement its long-term vision and ensure alignment with national priorities.
Download Presentation
Please find below an Image/Link to download the presentation.
The content on the website is provided AS IS for your information and personal use only. It may not be sold, licensed, or shared on other websites without obtaining consent from the author. Download presentation by click this link. If you encounter any issues during the download, it is possible that the publisher has removed the file from their server.
Presentation Transcript
BASIC EDUCATION 2020/21-2024/25 STRATEGIC PLAN AND ANNUAL PERFORMANCE PLAN 2023/24 Select Committee on Education & Technology, Sports, Arts & Culture 10 May 2023 1
PRESENTATION OUTLINE Purpose Size and Shape of the Basic Education Sector Background Government priorities Action Plan to 2024: Towards the Realisation of Schooling 2030 2019-2024 Medium-Term Strategic Framework (MTSF) and Education Sector Priorities Council of Education Ministers (CEM) priorities State of the Nation Address (SoNA) 2022/2023 Progress on selected deliverables (Including Infrastructure, Learning and Infrastructure) ECD function Annual plans towards long-term outcomes. Linking MTSF outcomes to APP approach and Strategic outcomes DBE SP 2020/21-2024/25 The DBE APP 2023/24 development process The DBE APP 2023/24 2023 Budget Allocation: Linking with budgets and policy Recommendation 2
PURPOSE To present the Department of Basic Education (DBE) Annual Performance Plan (APP) 2023/24 to the Portfolio Committee on Basic Education. To present a renewed focus on actions and efforts which results in learning and instructional effectiveness on outcomes and impacts. Plan supported by research and evidence with clarity of purpose and oversight. To present the 2023 budget allocation. 3
SIZE AND SHAPE OF THE BASIC EDUCATION SECTOR Sector Learners Educators Schools Size of the Schooling System: Public 405 050 22 740 12 706 157 Independent 703 092 42 073 2 154 Learners: 13 409 249 Educators: 447 123 Schools: 24 894 Total 13 409 249 447 123 24 894 Learners Educators Schools Official languages 9% 9% 5% English, isiZulu, isiXhosa, isiNdebele, Afrikaans, siSwati, Sepedi, Sesotho, Setswana, Tshivenda, Xitsonga, South African Sign Language 95% 91% 91% Public Independent Public Independent Public Independent 4
BACKGROUND Thepresentationoutlines the approach to Government-wide National Development Plan (NDP) priorities and the Education sector priorities based on the NDP 2030, MTSF 2019-2024 and Action Plan to 2024. The intention is to ensure programme activities in the sector align with medium and long-term goals. The Strategic Plan 2020/21-2024/25 is anchored on the Government s long-term plan; the National Development Plan 2030: Our future make it work, the MTSF 2019-2024 and the Action Plan to 2024. The Annual Performance Plan (APP) sets out what the Department intends to do in the financial year and during the Medium-Term Expenditure Framework (MTEF) period to implement its Strategic Plan. In fulfilling its legal obligation, the Department must produce and table an APP annually to Parliament. The Strategic Plan should cover a period of at least five years and can be amended during the five-year period it covers. The APP 2023/24represents the fourth year ofactivities towards achieving the objectives contained in the DBE Strategic Plan 2020/21-2024/25. 5
STRATEGIC DIRECTION How the sector plan relates to Sustainable Development Goals and other plans (and reports) Sector plan Action Plan to 2024: Towards the realisation of Schooling 2030 (access, redress, equity, inclusivity, quality, & efficiency) NATIONAL DEVELOPMENT PLAN (NDP) Independent analysis conducted by DBE Medium Term Strategic Framework (MTSF) DBE and PED five-year strategic plans Periodic reports on progress in the sector (see e.g., 2011 and 2013 reports on DBE website) Presidency External evaluations of key programmes; SONAs DBE and PED annual performance plans DBE and PED annual reports UNESCO 2030 AGENDA & CESA 2016-25 on the AFRICAN AGENDA 2063 PED quarterly sector reports 6 6
APPROACH IN THE STRATEGIC AND ANNUAL PERFORMANCE PLANS The outcomes are broad to consolidate work contributed by the sector to encourage joint planning than working in silos by individual programmes to reflect the aspirations at an organisational level including the support to PEDs. The approach to outcomes assists with clustering delivery areas which relate to strategic outcomes rather than just listing programmes and what they do. Interventions that contribute to school preparedness are in different parts of the department, for example. The strategic delivery areas and outputsbridge the gap between medium-to-long-term outcomes, short-term annual outputs and indicators in describing the intended change for the education system. Using the Theory of Changefor how the DBE can influence outcomes through its functions of developing policy, monitoring, and oversight (NEPA). Results Model to identify the critical success factors and deliverables of the sector to ensure NDP and sector outcomes are achieved. Evidence-based change in DBE, showing leadership of DBE through and with provinces. Branches have been engaged in the development of the APP, analysis of the MTSF, MTSF gaps and their implications on the APP. 7
KEY GOVERNMENT PRIORITIES (5 yrs) The MTSF 2019 2024 translates the ruling party s electoral mandate into government s priorities over a five-year period. The Basic Education is critical in priority 2,3, 4 and 6: Priority 1: A capable, ethical and developmental state. Priority 2: Economic transformation and job creation. Priority 3: Education, skills and health. Priority 4: Consolidating the social wage through reliable and quality basic services. (DBE reporting to DSD) Priority 5: Spatial integration, human settlements and local government. (DBE reporting to DSAC) Priority 6: Social cohesion and safe communities. Priority 7: A better Africa and world. 8
ACTION PLAN TO 2024: TOWARDS THE REALISATION OF SCHOOLING 2030 9
Action Plan to 2024: Towards the realisation of Schooling 2030 (access, redress, equity, inclusivity, quality, & efficiency) Goals 1 to 13: Improved Learning Outcomes - Improve learning outcomes in Language, Mathematics and Science as measured in Grades 3, 6, 9 and 12 Ensure full access to compulsory schooling Decrease grade repetition and retention Improve access to Further Education and Training (FET) colleges Improve quality of Grade R - - Goals 14 to 27: Interventions - the how to Improve Learning Outcomes - - Apex priorities post the pandemic Early Childhood Development Learning Losses and Outcomes Infrastructure 10
2019-2024 MEDIUM-TERM STRATEGIC FRAMEWORK (MTSF) AND EDUCATION SECTOR PRIORITIES 11
2019 2024 MEDIUM TERM STRATEGIC FRAMEWORK (MTSF) DBE OUTCOMES (5 yrs.) Sector Outcomes: These are goals or a state that identifies areas of sectoral performance that are critical to be achieved to realise progress. They should stretch and challenge the institution and focus on the sector s impact. Outcome 1: Improved school-readiness of children. Outcome 2: 10-year-old learners enrolled in publicly funded schools read for meaning. Outcome 3: Youths better prepared for further studies and the world of work beyond Grade 9. Outcome 4: Youths leaving the schooling system more prepared to contribute towards a prosperous and equitable South Africa. Outcome 5: School physical infrastructure and environment that inspires learners to learn and teachers to teach. 12
LINK BETWEEN MTSF OUTCOMES AND DBE APP (DBE OUTCOMES AND OUTPUTS) Strategic Outcomes: Outcomes are the medium-term results for specific beneficiaries which are the consequence of achieving specific outputs of programmes. Outcomes are What we wish to achieve and feed to the sector outcome/MTSF. MTSF Outcomes DBE Outcomes DBE Outputs linked Outcome 1: Improved school-readiness of children Outcome 1 Early Childhood Development fully migrated Outcome 2 Effective school administration monitored Determination of school readiness reported Outcome 3 Qualifications for Grade R practitioners assessed Outcome 2: 10-year- old learners enrolled in publicly funded schools read for meaning Outcome 1 Children/Learners with Profound Intellectual Disability supported Policy on Screening, Identification, Assessment and Support (SIAS) implemented Outcome 3 Implementation of reading norms monitored Implementation of Incremental Introduction to African Languages monitored Implementation of Early Grade Reading Assessment monitored Implementation of National Reading Plan monitored Availability of readers monitored Outcome 4 Workbooks provided to schools Lesson plans developed Outcome 5 Capacitated teachers in inclusion Learners admitted in public special schools Public special schools serving as resource centres monitored 13
LINK BETWEEN MTSF OUTCOMES AND DBE APP (DBE OUTCOMES AND OUTPUTS) MTSF Outcomes DBE Outcomes DBE Outputs linked Outcome 3: Youths better prepared for further studies and the world of work beyond Grade 9 Outcome 1 Entrepreneurship education implemented in schools Implementation of General Education Certificate Monitored Monitored pilot on Coding and Robotics curriculum Outcome 2 School Governing Bodies monitored Effective school management process Funza Lushaka bursaries awarded Funza Lushaka graduates placed Qualified teachers aged 30 and below appointed Test items developed Learning Outcomes assessed Outcome 4 Learner textbooks on Mathematics and EFAL provided Outcome 5 Performance management monitored Support to school principals rated District Directors capacitated Underperforming Schools Supported Teacher development conducted District Director forums conducted Outcome 6 14
LINK BETWEEN MTSF OUTCOMES AND DBE APP (DBE OUTCOMES AND OUTPUTS) MTSF Outcomes DBE Outcomes DBE Outputs linked Outcome 4: Youths leaving the schooling system more prepared to contribute towards a prosperous and equitable South Africa Increased Bachelor Level Passes Leaner health and wellness improved Informed stakeholders and partners Gender-based violence programmes implemented Outcome 1 Schools monitored on Implementation of CAPS Technical Occupational Stream Piloted Monitored pilot on Coding and Robotics curriculum Leaner subject passes in NSC/SC through SCMP obtained Implementation of National Curriculum Statement Monitored Outcome 2 School and learner performance on NSC produced Examination question papers set Teacher development monitored Focus schools established Officials in districts below the national benchmark mentored New schools completed School sanitation facilities provided School water facilities provided Monitored provision of nutritious meals Safe, active and social friendly schools Implementation of multi-grade toolkit monitored Utilisation of ICT resources monitored Special schools' access to electronic devices monitored Provision of ICT devices monitored Outcome 3 Outcome 5 Outcome 5: School physical infrastructure and environment that inspires learners to learn and teachers to teach Outcome 1 Outcome 3 Outcome 4 15
COUNCIL OF EDUCATION MINISTERS (CEM) PRIORITIES FOR THE SIXTH ADMINISTRATION (5 yrs) These priorities were approved by the Council of Education Ministers to lay a solid foundation for quality education, in support of improved reading and learning outcomes: 1. Improving foundational skills of Numeracy and Literacy, especially reading which should be underpinned by a Reading Revolution. (Outcome 1&2) 4. Urgent implementation of two (2) years of ECD before Grade 1, and the migration of the 0 - 4 year olds from the Department of Social Development (DSD) to the Department of Basic Education (DBE). (Outcome 1&2) 2. Immediate implementation of a curriculum with skills and competencies for a changing world in all public schools (Three Stream Model, Fourth Industrial Revolution, Entrepreneurship, Focus Schools, etc.). (Outcome 2, 3 &4) 5. Complete an integrated Infrastructure Development Plan informed by infrastructure delivery and regular maintenance which is resourced. (Outcome 5) 3. Deal decisively with quality and efficiency through the implementation of standardised assessments to reduce failure, repetition, and drop out rates and introduce multiple qualifications such as the General Education Certificate before the Grade 12 exit qualification. (Outcome 1, 2, 3 & 4) 6. Work with Departments of Sport and Arts and Culture; Health; and the South African Police Services to teach and promote Social Cohesion, Health and School Safety. (Priority 6) 16 16
STATE OF THE NATION ADDRESS (SoNA) (Annual) 17
SONA 2023 Early Childhood Development (ECD) Commitments Progress Provide young children with a foundation to read for meaning, learn and develop Under-resourced ECD programmes will be provided with daily activity plans and integrated learning and teaching resources. Funding has been secured for this and the procurement process is due to start in the 2023/24 financial year. Increase the ECD subsidy to reach more children in need Up to Q3 in 2022/24; 315,198 children received the subsidy through the conditional grant, and 523,575 children received the subsidy through the equitable share. Streamline the requirements for ECD centres to access support and subsidies The DBE has been engaging with the Red Tape Reduction Unit in the Presidency to identify areas in which we can streamline to process of registering ECD programmes so that they can access the subsidy. - - - - Systems for planning developed Quality assurance system in place Second Children s Amendment Bill Evaluation of the National Integrated Early Childhood Development Policy (NIECDP) 18
SONA 2023 Three Streams Model Commitments Progress To produce the skills our country needs to expand vocational education and training systems through the implementation of the approved curriculum of the three stream model Continued improvements on Technical Maths and Sciences. Focus schools were introduced. Increased enrolments In Technical Subjects specialisations. New Curricula developed: E-Commerce & Entrepreneurship, marine sciences and aviation studies 19
2021-22 SONA in progress Reading Curriculum - Early grade reading study - Functionality of school libraries - Comprehension across the curriculum - Curriculum Strengthening - Recovery of Learning Inclusive education Skills for a changing world - Mobilisation of out-of-school children/learners of school-going age - Improvement of teacher competencies and qualifications in specialised areas of inclusion - Implementation of SIAS - ICT Provision of Devices and Connectivity - ICT Provision to Public Ordinary Schools - Coding and Robotics piloted Infrastructure Social cohesion - Continued implementation of the SAFE programme - Continued implementation of the ASIDI programme - Dealing with overcrowding -Social cohesion and equity -Health promotion -National school nutrition programme -School safety 20
PROGRESS ON SELECTED KEY DELIVERABLES 21
ASIDI OVERALL PROGRESS PER SUB-PROGRAMME Cumulative ASIDI Summary from inception to 24 April 2023 Sub-Programme Description Number of schools per stage of progress Total Schools allocated Planning & Design Tender Construc tion <25% Construction <25- 50% Constructi on <51-75% Constructi on <76-99% Practical Completio n Summary 3004 1 13 36 21 61 33 2839 Inappropri ate Structure Total 331 - - - 3 2 11 330 Water Supply Total 1272 - - 1 - 2 10 1292 Sanitation Total 1053 - - - - - - 1085 Electricity Supply Total 373 - - - - - - 373 Fencing Total 4 - - - - - - 4 22
SPECIAL NEEDS EDUCATION (SNE) LEARNERS WHO PASSED NSC FOR 2022 The core promise of the National Development Plan s Vision 2030 is to leave no one behind, and the DBE aims to fulfil this commitment towards persons with disabilities. A total of 439 learners with special needs attained admission to Bachelor studies, 264 achieved admission to diploma studies, and 108 achieved admission to higher certificate studies out of the 1 092 who wrote. Result Status Total Achieved Bachelor 439 Achieved Diploma 264 Achieved Higher Certificate 108 Achieved Endorsed 82 Total Achieved 893 25
PROGRAMME 2 Workbooks Delivery Status: All Provinces(Volume 1 Grades 1 - 9 and Grade R) TOTAL SCHOOLS ALLOCATED SUM OF SCHOOLS TOTAL BOOKS ALLOCATED SUM OF BOOKS PROVIN CE SCHOOLS DISPATCHED BOOKS DISPATCHED SCHOOLS DELIVERED BOOKS DELIVERED % SCHOOLS DELIVERED % BOOKS DELIVERED SUM OF DPSCHOOLS SUM OF DPBOOKS SUM OF DELSCHOOLS SUM OF DELBOOKS - - EC 4,913 4,114,010 4,913 4,114,010 4,913 4,114,010 100.00% 100.00% FS 938 1,702,650 938 1,702,650 938 1,702,650 100.00% 100.00% GP 2,068 5,147,975 2,068 5,147,975 2,068 5,147,975 100.00% 100.00% KZN 5,958 6,187,040 5,958 6,187,040 5,958 6,187,040 100.00% 100.00% LP 3,672 4,003,770 3,672 4,003,770 3,672 4,003,770 100.00% 100.00% MP 1,661 2,981,420 1,661 2,981,420 1,661 2,981,420 100.00% 100.00% NC 545 773,970 545 773,970 545 773,970 100.00% 100.00% NW 1,465 2,028,155 1,465 2,028,155 1,465 2,028,155 100.00% 100.00% WC 1,518 2,643,130 1,518 2,643,130 1,518 2,643,130 100.00% 100.00% Grand Total 22,738 29,582,120 22,738 29,582,120 22,738 29,582,120 100.00% 100.00% As at 13 January 2023 26
PROGRAMME 3 Placement of Funza Lushaka Graduates PROVINCE PLACED UNPLACED GRAND TOTAL PLACEMENT% 393 193 516 277 591 228 166 69 521 306 76 217 404 31 189 23 9 139 699 296 733 681 622 417 189 78 660 56% 72% 70% 41% 95% 55% 88% 88% 79% EASTERN CAPE FREE STATE GAUTENG KWAZULU-NATAL LIMPOPO MPUMALANGA NORTH WEST NORTHERN CAPE WESTERN CAPE GRAND TOTAL 2 954 1 394 4 348 68% Source: PERSAL December 2022 and PED reports 27
PROGRAMME 5 National School Nutrition Programme (NSNP) Provincial Performance Indicators EC Number of learners in quintile 1 - 3 primary schools 1022394 375797 704025 1331209 1025379 594105 120230449640 3021205924899 Number of learners in quintile 1 - 3 secondary schools 595076 206049 373831 793031 625877 324013 60008 222950 1138683314703 Number of learners in Special Schools 8613 3254 38609 14751 Number of learners in quintile 4 - 5 primary schools - - 20337 125302 Number of learners in quintile 4 - 5 secondary schools - - 13425 86896 Total Number of learners reached 1626083 585100 1150227 2351189 1659578 920110 210222677078 5097139689300 FS GP KZN LP MP NC NW WC Total 8322 1992 1824 4488 12804 94657 - - 18958 - 71309 235906 - - 9202 - 9612 119135 As at 31 December 2022 28
THE DBE APP 2023/24 DEVELOPMENT PROCESS 29
OVERSIGHT FINDINGS ON DRAFT APP (DPME&AGSA) DPME: Findings implemented AGSA: Findings implemented - Provide more reflection of Budget Prioritisation framework Strengthen the information provided in the explanation for planned performance over the planning period and in the section on resource considerations Strengthen the Technical Indicator Descriptions (TIDs) - Strengthen the Technical Indicator Descriptions (TIDs) Department to focus less on reports Provide emphasis on what needs to be done Provide emphasis on programme design towards learning and instruction - - - - - All findings raised by oversight bodies were discussed with programmes implicated and presented in management meetings. Actions and responses were provided to all the findings 30
MTSF AREAS TO BE STRENGTHENED IN PROVINCIAL AND NATIONAL APPs Introduce a better accountability system for principals, which should be fair, based on appropriate data, and take into account the socio-economic context of schools. Some provinces have started the political and technical work around looking at accounting for performance in terms of learning outcomes and organisational effectiveness to support this at school level. GEC full scale to be implemented in 2025, while there are pilot projects between 2021-2024. Promote a comprehensive package of effective Teacher development, such as Professional Learning Communities (PLCs) and technology-enhanced in-service training. Teacher development packages and spend disaggregated by phase, subject and district will have to also include some reflection on impact. Evaluation of the NIECPD. Strengthened Numeracy, Reading and ECD indicators which are linked to outcomes in classrooms. Sector Monitoring (Standardised Output Indicators) Standardisation concerns: lagging behind priorities across PEDs Standardised ECD indicators to guide implementation. 31
MTSF AREAS TO BE STRENGTHENED IN PROVINCIAL AND NATIONAL APPs (2) Increase access among historically disadvantaged learners to niche subjects such as those focusing on engineering and computing. HRD is imperative for success. Oversight for existing subjects in addition to those in the 3 streams model Monitoring of participation in the curriculum at learner level in different sorts of schools e.g. Technical Occupational Curriculum in ordinary, schools of skill, etc. needs refinement. ICT provision in schools. Primary learning outcomes The 2025 Systemic Evaluation to provide data on a sample basis, but need to be able to help individuals schools as per NDP. Strengthened Numeracy, Reading, and ECD indicators which are liked to outcomes in classrooms. National Numeracy programme Schoolpreparedness concerns a priority: departmental outcomes as per surveys Evidence needed. Information needs to be subjected to credibility and reliability test as those monitored through the APP and for delivery. 32
STANDARDISATION OF SECTOR INDICATORS The DBE provides oversight, monitoring and support to the PEDs. In this regard, the sector has established monitoring systems to track priority areas. The Standardised Output Indicators (SOIs) have been developed in consultation with the Provincial Education Departments (PEDs) to ensure uniformity in the sector and to align with Government priorities, namely the Medium-Term Strategic Framework (MTSF). The Heads of Education Department Committee (HEDCOM) Sub- committee on Planning, Monitoring and Evaluation (PME) addresses the sector priorities for improving teaching and learning, and reflects maturity in stabilising the basic education sector. The HEDCOM Sub-committee on PME provides a forum for strategic interaction on information sharing, capacity building and exchange of best practices in relation to improving basic education sector performance. 33
STANDARDISATION OF SECTOR INDICATORS The PEDs are required to incorporate in their Annual Performance Plans (APPs), Standardised Output Indicators (SOIs) to align to the revised framework for Strategic Plan and APP, as well as monitor the performance reported in the Quarterly and Annual Reports. The DBE will continue to ensure uniformity in the sector through tracking priorities. the 34
THE DBE STRATEGIC PLAN 2020/21-2024/25 35
STRATEGIC PLAN 2020/21-2024/25 IMPACT STATEMENT, OUTCOMES AND INDICATORS Provide quality basic education for all, and lead the establishment and development of a South African schooling system for the 21st century. Outcome 1: Improved system of policies, including the curriculum and assessment, governing the basic education sector to advance a quality and inclusive, safe and healthy basic education system Outcome Indicator Baseline 1.1 Improve the proportion of 6- year-olds (Grade R) enrolled in educational institutions by 2024 Five-Year Target 99% 96% respectively (2017) 1.2 Improve the proportion of 5- year-olds (Grade RR) enrolled in educational institutions by 2024 85.4% (2018) Enrolment rates of 5 and 6- year-olds at 95% by 2024 1.3 Improve the proportion of Grade R learners that are school ready by 2024 New: System for monitoring quality will be implemented to determine the baseline by 2021 15% increase off the baseline that will be established in 2021 36
STRATEGIC PLAN 2020/21-2024/25 IMPACT STATEMENT, OUTCOMES AND INDICATORS Provide quality basic education for all, and lead the establishment and development of a South African schooling system for the 21st century. Outcome 1: Improved system of policies, including the curriculum and assessment, governing the basic education sector to advance a quality and inclusive, safe and healthy basic education system Outcome Indicator 1.4 Increase the number of youths obtaining Bachelor-level passes in the NSC by 2024 Baseline Bachelor-level passes in NSC: 172 043 (33.6%) in 2018 Five-Year Target Bachelor-level passes: 190 000 by 2024 1.5 Increase the number of youths obtaining 60% and above in Mathematics by 2024 Youths passing Mathematics at 60% and above: 28 151 (12%) in 2018 Youths passing Mathematics at 60% and above: 35 000 1.6 Increase the number of youths obtaining 60% and above in Physical Science by 2024 Youths passing Physical Science at 60% and above: 30 368 (17.6%) in 2018 Youths passing Physical Science at 60% and above: 35 000 37
STRATEGIC PLAN 2020/21-2024/25 IMPACT STATEMENT, OUTCOMES AND INDICATORS Provide quality basic education for all, and lead the establishment and development of a South African schooling system for the 21st century. Outcome 2: Improved information and other systems which enable transformation and an efficient and accountable sector Outcome Indicator 2.1 Improve learning outcomes in Grade 6 in critical subjects reflected through the new Systemic Evaluation by 2024 Baseline New Five-Year Target Grade 6 performance in the new Systemic Evaluation: Mathematics Literacy: (targets to be determined after first assessment) Grade 9 performance in the new Systemic Evaluation - Mathematics: (targets to be determined after first assessment) Average score for Grade 6 (SEACMEQ) for: Mathematics: 600 by 2022 2.2 Improve learning outcomes in Grade 9 in critical subjects reflected through the new Systemic Evaluation by 2024 New 2.3 Improve learning outcomes in Grade 6 Mathematics according to the international SEACMEQ by 2020 Average score for Grade 6 in the SEACMEQ: Mathematics: 552 (2013) 38
STRATEGIC PLAN 2020/21-2024/25 IMPACT STATEMENT, OUTCOMES AND INDICATORS Provide quality basic education for all, and lead the establishment and development of a South African schooling system for the 21st century. Outcome 2: Improved information and other systems which enable transformation and an efficient and accountable sector Outcome Indicator 2.4 Improve learning outcomes in Grade 6 Reading according to the international SEACMEQ by 2020 Baseline Average score for Grade 6 in the SEACMEQ: Literacy: 538 (2013) Five-Year Target Average score for Grade 6 in the SEACMEQ: Literacy: 600 by 2022. 2.5 Improve learning outcomes in Grade 9 in Mathematics in the TIMSS programmes by 2023 Grade 9 performance in the TIMSS: Mathematics: 372 (2015) Average score for Grade 9 in the Trends in International Mathematics and Science Study (TIMSS): Mathematics: 420 by 2023 Average score for Grade 9 in the TIMSS: Science: 420 by 2023 2.6 Improve learning outcomes in Grade 9 Science in the TIMSS programmes by 2023 Grade 9 performance in the TIMSS: Science: 358 (2015) 39
STRATEGIC PLAN 2020/21-2024/25 IMPACT STATEMENT, OUTCOMES AND INDICATORS Provide quality basic education for all, and lead the establishment and development of a South African schooling system for the 21st century. Outcome 3: Improved knowledge, monitoring and research functions to advance more evidence-driven planning, instruction and delivery Outcome Indicator 3.1 Improve the proportion of Grade 3 learners reaching the required competency levels in reading and numeracy skills as assessed through the new Systemic Evaluation by 2024 Baseline New Five-Year Target Grade 3 performance in the new Systemic Evaluation: Reading: (targets to be determined after first assessment) 3.2 Increase the average score obtained by Grade 4 learners in the PIRLS by 2021 320 average score in the PIRLS (2016) 355 average score in the PIRLS by 2021 3.3 Increase the average score obtained by Grade 5 learners in the TIMSS by 2023 376 average score in the TIMSS (2015) 426 average score in the TIMSS score by 2023 40
STRATEGIC PLAN 2020/21-2024/25 IMPACT STATEMENT, OUTCOMES AND INDICATORS Provide quality basic education for all, and lead the establishment and development of a South African schooling system for the 21st century. Outcome 4: Advanced development of innovative and high-quality educational materials Outcome Indicator 4.1 Increase the percentage of schools with access to functional internet connectivity for teaching and learning, connected through different options working with the DCDT (Department of Communications and Digital Technologies). Baseline 64% of schools have some connectivity (POA Q4: 2018/19) Five-Year Target 90% to be connected for teaching and learning (DTPS and private sector) 4.2 Improve the availability of quality early reading materials for teaching Home Language Literacy in indigenous languages (this is an intervention on the MTSF) New 100% of Grade 3 learners who learn through indigenous languages have graded reading books 41
STRATEGIC PLAN 2020/21-2024/25 IMPACT STATEMENT, OUTCOMES AND INDICATORS Provide quality basic education for all, and lead the establishment and development of a South African schooling system for the 21st century. Outcome 5: Enhanced strategic interventions to assist and develop provincial education systems Outcome Indicator 5.1 Increase the number of mediation sessions conducted to ensure accurate interpretation of assessment data Baseline New Five-Year Target 7 by 2024/25 Outcome 6: Improved communication of information and partnerships with stakeholders 6.1 Increase the number of District Directors forums held 3 per year 12 by 2024/25 42
THE DBE ANNUAL PERFORMANCE PLAN 2023/24 43
2023/24 ANNUAL PERFORMANCE PLAN The Annual Performance Plan is divided into four (4) parts: Part A: Mandate Part B: Strategic Focus Part C: Measuring Our Performance Part D: Technical Indicator Descriptions (TIDs) 44
PROGRAMMES OF THE DBE The activities of the DBE have been structured into five (5) programmes as elaborated in the Annual Performance Plan: PROGRAMME 1: ADMINISTRATION PROGRAMME 2: CURRICULUM POLICY, SUPPORT AND MONITORING PROGRAMME 3: TEACHERS, EDUCATION HUMAN RESOURCES AND INSTITUTIONAL DEVELOPMENT PROGRAMME 4: PLANNING, INFORMATION AND ASSESSMENT PROGRAMME 5: EDUCATIONAL ENRICHMENT SERVICES 45
2023/24 APP PROGRAMME PERFORMANCE INDICATORS No. of indicators per Branch No. of indicators per programme Bi- Quarterly Targets Biennial Target Branch Programme Annual Targets annual Targets A 4 One 6 2 4 - - BI 4 Two 31 29 1 1 - C 22 Three 11 10 1 - - D 21 Four 15 14 - - 1 S 6 Five 6 3 3 - - Total T 9 69 58 9 1 1 distribution Percentage distribution 100% I 3 84% 13% 1% 1% 46
2023/24 APP TARGET AMENDMENTS Indicator Updates 2023/24 2024/25 2025/26 2.1.2 Second Chance Matric Programme Old 60000 65000 70000 New 80000 90000 100000 2.2.3 Implementation of EGRA Old 18 18 18 New 36 36 36 4.1.1 ASIDI: New Schools Old - - - New 9 12 20 4.1.2 ASIDI: Sanitation Old - - - New 350 400 450 4.1.3 ASIDI: Water Old - - - New 1 30 40 47
2023/24 APP TARGET AMENDMENTS Indicator Updates 2023/24 2024/25 2025/26 5.1.3 Number of districts monitored on the implementation of the National School Safety Framework (NSSF) Programmes Old 75 75 75 New 25 25 25 5.1.5 Number of participants and stakeholders reached with dialogues, engagements and training workshops to end school-related gender-based violence Old 75 75 75 4000 5000 6000 New 48
2023/24 APP INDICATOR AMENDMENTS The following indicators were revised to be aligned with the MTSF deliverables for 2023/24: 2.1.2 Number of learners obtaining subject passes towards a National Senior Certificate (NSC) or Senior Certificate (amended) SC(a) supported through the Second Chance Matric Programme per year. 2.1.5 An Annual National Report is produced on piloting the new funding model for Early Childhood Development (ECD). 2.1.6 An Annual Sector Report is produced on monitoring the registration of ECD Programmes. 2.3.7 Number of public special schools provided with electronic devices as part of the Universal Service Access Obligations. The following indicator was removed for 2023/24 and monitoring will continue through the MTSF and the new indicator will be crafted for 2024/25. 4.3.5 Number of districts in which teacher development has been conducted as per district improvement plans 49
2023/24 APP: PROGRAMME 1 Medium-term targets Output Indicators Reporting Cycle 2023/24 100% 2024/25 100% 2025/26 100% 1.1.1 Percentage of valid invoices paid within 30 days upon receipt by the Department 1.1.2 Number of reports on misconduct cases resolved within 90 days Quarterly Quarterly 4 4 4 1.1.3 Number of capacity building programmes offered to the DBE officials Annually 15 16 16 1.1.4 Number of Schedule 4 and 5 Conditional Grants Quarterly Performance Reports submitted to National Treasury (NT) 45 days after the end of each quarter Quarterly 24 24 24 1.2.1 Annual Performance Plan approved by 31 March each financial year Annually 2024/25 APP approved by March 2024 2025/26 APP approved by March 2025 2026/27 APP approved by March 2026 4 1.2.2 Number of Quarterly Performance Reports submitted to National Treasury (NT) and the DPME 30 days after the end of each quarter Quarterly 4 4 50
