Manufacturing Sector Growth and Trends Analysis Report
The annual distributor report for 2014 provides valuable insights into the bearing industry, including sales data, aggregate sales volume, employee numbers, sales by industry served, and the growth perspective of manufacturers. The report highlights the significant contribution of the manufacturing sector to the economy and its resilience in supporting economic recovery. With detailed statistics and trends, it showcases the strength and impact of manufacturing on the overall GDP growth and industrial landscape.
Download Presentation

Please find below an Image/Link to download the presentation.
The content on the website is provided AS IS for your information and personal use only. It may not be sold, licensed, or shared on other websites without obtaining consent from the author. Download presentation by click this link. If you encounter any issues during the download, it is possible that the publisher has removed the file from their server.
E N D
Presentation Transcript
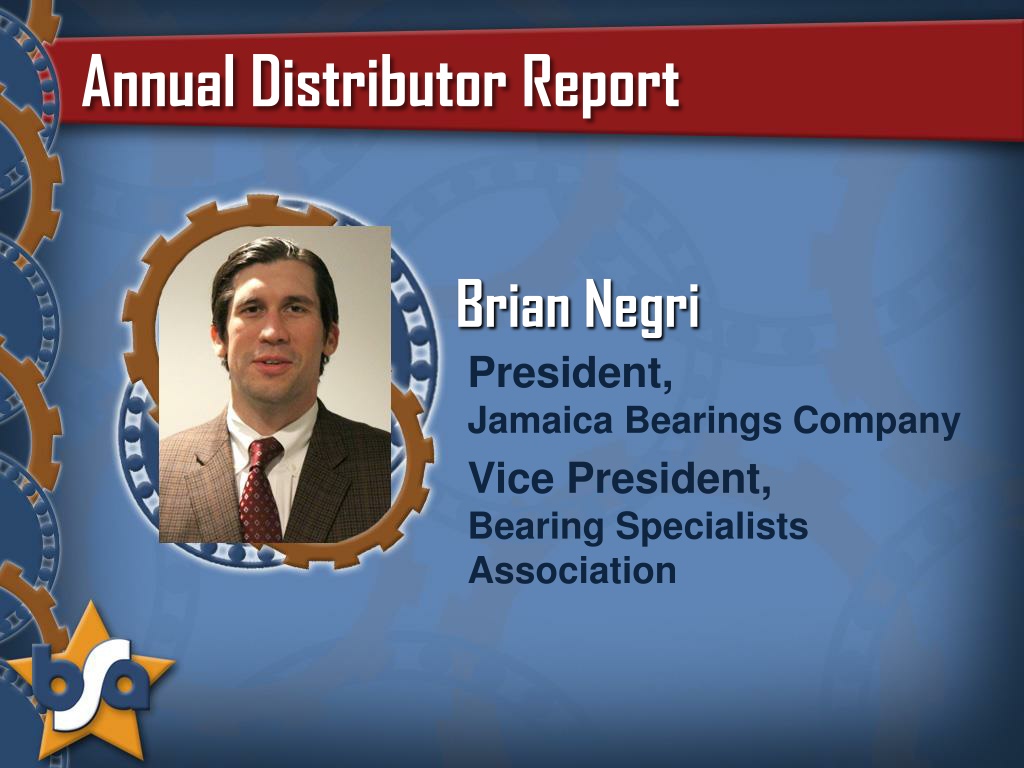
Annual Distributor Report Brian Negri President, Jamaica Bearings Company Vice President, Bearing Specialists Association
BSA 2014 DISTRIBUTOR REPORT PREPARED BY AL BATES/PROFIT PLANNING GROUP COMPLETED SURVEYS SENT DIRECTLY TO PPG ALL DATA HELD IN CONFIDENCE DATA ACCUMULATED AND RESULTS PRODUCED BY PPG
BSA 2014 DISTRIBUTOR REPORT REPORT DATA 2008-2013 24 PARTICIPATING FIRMS (UP 1 FROM 2013) DATA = 90% TOTAL BEARINGS SOLD BY MEMBERSHIP
Single page snapshot Sales/employ ment/ suppliers/growt h By Industry By Product category
AGGREGATE SALES VOLUME 3.50 2.97 3.00 2.75 2.71 2.63 2.58 2.50 2.25 1.92 2.00 1.50 1.00 0.50 0.00 2008 2009 2010 2011 2012 2013 2014fcst
AGGREGATE NUMBER OF EMPLOYEES 25,000 20,600 20,400 20,000 17,600 17,000 16,700 16,600 15,000 10,000 5,000 0 2008 2009 2010 2011 2012 2013
SALES BY INDUSTRY SERVED 18.6 MANUFACTURING Food & Bev 6 Primary metals 49.2 Forest products 7.8 Resellers others 7.9 10.5
New Growth Perspective Shows Manufacturers' Muscle The manufacturing sector accounted for nearly one-quarter of last year's 1.9% increase in gross domestic product Manufacturing made outsized gains to the economy last year, which both reflects the softness of the overall real GDP figure and the significant spillover effects from manufacturing
Manufacturing powers ahead: Though U.S. manufacturing has gotten a lot of bad press in recent years as it lost ground to foreign competitors, it has lately been providing vital support for the economic recovery. It accounted for 1.23 percentage point of the fourth quarter s 2.6% annual GDP growth rate as well as 0.4 percentage point of overall 2013 growth of 1.9%, making it the leading contributor to growth in both periods. Manufacturing accounted for 12.4% of economic output last year, leaving it as the nation s third-largest industry and little changed from before the recession.
SALES BY PRODUCT CATEGORY Sales Ball bearings TRB Roller bearings mounted SRB Ball bearings mounted Precision ball bearings CRB
INDUSTRIAL DISTRIBUTION BIG 50 ECONOMIC CONCERNS PICK UP IN 2013 AFTER EASING IN 11 & 12 MOTION INDUSTRIES AIT KAMAN BDI DXP IBT ECONOMISTS: MIXED BAG FUTURE THREATS: AMAZON & GOOGLE M&A ACTIVITY CAUTIOUS OPTIMISM
2013 PAR REPORT BEARINGS = 35% OF TOTAL SALES SMALLER=HIGHER / LARGER = LOWER 47% IN HIGH PROFIT DISTRIBUTORS 80/20 SPLIT BETWEEN OEM AND MRO ON AVERAGE, SLS VOLUME INCREASED 3% FINANCIAL RATIOS, ASSET PRODUCTIVITY, GROWTH AND CASH SUFFICIENCY, PRODUCT MIX, GLOBAL SALES, SKUS, OPERATING COSTS AND SALES PER EMPLOYEE
PAR: GM AND OPEREATING EXPENSE 27 26 25 GM OPER EXP 24 23 22 21 2009 2010 2011 2012 2013
CONCLUSIONS RECORD SLS OF $2.75B BUT 5% MISS TO PLAN COLLECTIVE 8% GROWTH TARGET FOR 2014 WITH CAUTIOUS OPTIMISM QUESTIONS ABOUT THE ONGOING STRENGTH OF THE ECONOMIC RECOVERY M&A / CONSOLIDATION
