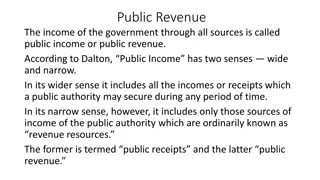
Tanzania's National Economy Overview: Trade, Sector Composition, and Revenue Sources
Tanzania's national economy reflects a mix of formal and informal trade sectors, with a significant share of taxes contributing to the established income. The informal sector plays a substantial role, especially in employment. Manufacturing, agriculture, services, and trade sectors contribute to the GDP, supported by various revenue sources including grants, loans, and tax revenue.

Download Presentation

Please find below an Image/Link to download the presentation.
The content on the website is provided AS IS for your information and personal use only. It may not be sold, licensed, or shared on other websites without obtaining consent from the author. Download presentation by click this link. If you encounter any issues during the download, it is possible that the publisher has removed the file from their server.
E N D
Presentation Transcript
Broad outline of the national economy Case of Tanzania Julius Mbeya Tax Justice training MS TCDC Arusha
The share of Formal and Informal Trade in Tanzania s GDP for 2010, 2011 and 2012. SHARE OF INFORMAL TRADE IN SHARE OF FORMAL TRADE IN YEAR GDP (%) GDP (%) 2010 38.4 12.1 2011 51.3 12.1 2012 46.5 12.3
The share of Formal and Informal Trade in Tanzanias GDP for 2010, 2011 and 2012 in percentage.
Formal versus formal sector The informal Trade or informal sector is that part of an economy that is not taxed, monitored by any form of government, or included in any gross national product (GNP), unlike the formal economy. Statistics on the informal economy are unreliable by virtue of the subject, yet they can provide a tentative picture of its relevance
Formal versus informal contd For example, informal employment makes up 48% of non-agricultural employment in North Africa, 51% in Latin America, 65% in Asia, and 72% in sub-Saharan Africa. If agricultural employment is included, the percentage rises, in some countries like India and many sub-Saharan African countries beyond 90%. Estimates for developed countries are around 15%.
Share of manufacturing, agriculture, services and trade in Tanzania s GDP for 2010, 2011 and 2012 MANUFACTURING AGRICULTURE YEAR SERVICES (%) TRADE (%) (%) (%) 2010 9.0 24.1 43.9 12.1 2011 9.3 23.7 44.0 12.2 2012 9.9 24.7 43.9 12.3
Main sources of income between 2010 and 2012 Revenue from Local Government own source 350.5 billion shillings (taxes and other own revenues) Progamme grants and loans 869.4 billion shillings; Budget support grants and loans for development project and sector (basket funds) 3,054.1 billion shillings Domestic and foreign loans shillings 1,664.9 billion Matured treasury bills and bonds estimated at Tshs. 810.9 billion.
The share of taxes in the established income for each of the three years Year 2010 2011 2012 Tax share 81% 84% 85%
The share of aid in Tanzanias income between 2010 2012 During the period between 2010 - 2012 the percentage contribution of foreign aid (also called General Budget Support {GBS}) to the overall Tanzania national budget has been decreasing yearly Percentage contributions estimates has been ranging between 40, 33.4, and 28.2
The share of aid in Tanzanias income cont d Although it is true that the proportion of GBS in the budget has been decreasing since 2010, it constitutes the majority of total development expenditure. GBS is not the only source of donor money in the budget since in addition to GBS, donors provide sector basket funding, project grants, and soft loans. There are also many other development projects funded by donors that do not show in the budget.
Tax to GDP rates in 2008 % GDP Indirect Tax Direct Tax Other Low Income 4.9 4.6 2.0 Lower Middle 4.6 5.1 14.9 Income Upper Middle 6.3 8.6 21.4 Income
The ratio of tax to GDP 2010/12 Tax to GDP ratio is a proportion of tax collected against the national gross domestic product (GDP), calculated as total government revenues divided by a country s GDP. Some countries, like Sweden, have a high tax-to-GDP ratio (as high as 54%). Other countries, like India and much of the developing world, have a low ratio.
The ratio of tax to GDP contd In Tanzania the tax to GDP ratio rose from 14.6%, 15.3%, and approximately 15.8% from 2010 -2012 respectively which lies considerably below the average for sub- Saharan Africa of 16.4%.
Tax Revenue as % of GDP Tax Revenue as % of GDP 18% 16% 14% 12% 10% 8% 6%
The share of debt to GDP 2010/12 Debt to GDP ratio is simply a measure of a country's national debt in relation to its gross domestic product (GDP). By comparing what a country owes to what it produces, the debt-to-GDP ratio indicates the country's ability to pay back its debt. Debt is the entire stock of direct government fixed-term contractual obligations to others outstanding on a particular date.
The share of debt to GDP contd It includes domestic and foreign liabilities such as currency and money deposits, securities other than shares, and loans. It is the gross amount of government liabilities reduced by the amount of equity and financial derivatives held by the government. Because debt is a stock rather than a flow, it is measured as of a given date, usually the last day of the fiscal year.
The share of debt to GDP contd For the case of Tanzania, the ratio of National debt to GDP was approximately 40.4%, 36.4 and 34.7% in 2012, 2011 and 2010 respectively This covered both external and domestic debts. If this level if not checked, it could raise concerns on the sustainability of national debt.
Taxes in Tanzania 1. Revenue Sources The Government revenue source emanate from Domestic revenue, Tax revenue Non-tax revenue Domestic borrowing, External grants and External loans. Among the public revenues tax revenue is the most reliable source for government, It accounts on average for more than 90% of domestic revenues.
Revenue sources - (Contd) Composition of Domestic Revenue 20% 18% 16% 14% Revenue as % of GDP 12% 10% 8% 6% 4% 2% 0% Total Rvenue Tax Revenue Non-tax Revenue
Revenue sources - (Contd) Tax revenue collections increased from 8.5% of GDP in 1999/00 to 15.7% in 2011/12 and estimated at 16.6% in 2012/13 still below average of sub-Saharan Africa (17.5%). Expenditure increased from 12.1% of GDP in 1998/99 to 26.3% in 2011/12.
Revenue sources - (Contd) On average, about 40% of budget expenditure is financed from external sources (loans and grants) and 60% is from domestic sources (57% from domestic revenue and 3% being domestic borrowing).
Comparison of Value Added Tax Rate is comparable: Tanzania 18% ; Kenya - 16%; Peru - 18%; Zambia - 16%; Mauritius - 15%, Georgia - 18%, Rwanda - 18% and Uganda - 18% VAT revenue to GDP ratios: Tanzania s - 4.9%; Kenya - 6.2%; Peru 7.5%; Mauritius - 8.1%; Georgia - 12.5%; Brazil - 8.6%
The Tax structure in Tanzania Central Government taxes comprise direct and indirect taxes. Direct taxes account for around 30% of total tax revenue, Indirect taxes account for around 70% of total tax revenue.
Tax Structure (contd) Direct taxes include: Personal Income Taxes (PIT), Corporate Income Tax (CIT) and Withholding Taxes (WT) on business, capital and investment incomes Indirect taxes comprise: Taxes on international trade; Domestically produced goods and services explicitly the value added tax, excises and import duties
Tax base and rate structure(contd) Withholding taxes on business and capital incomes Dividends Interest Rent and Royalties are applicable at the rates ranging between 10% to 20%.


")
")
")


")
")