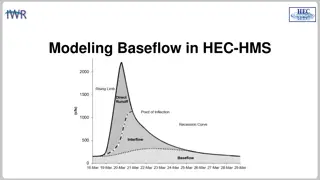
Understanding the Recession Baseflow Method in Hydrology
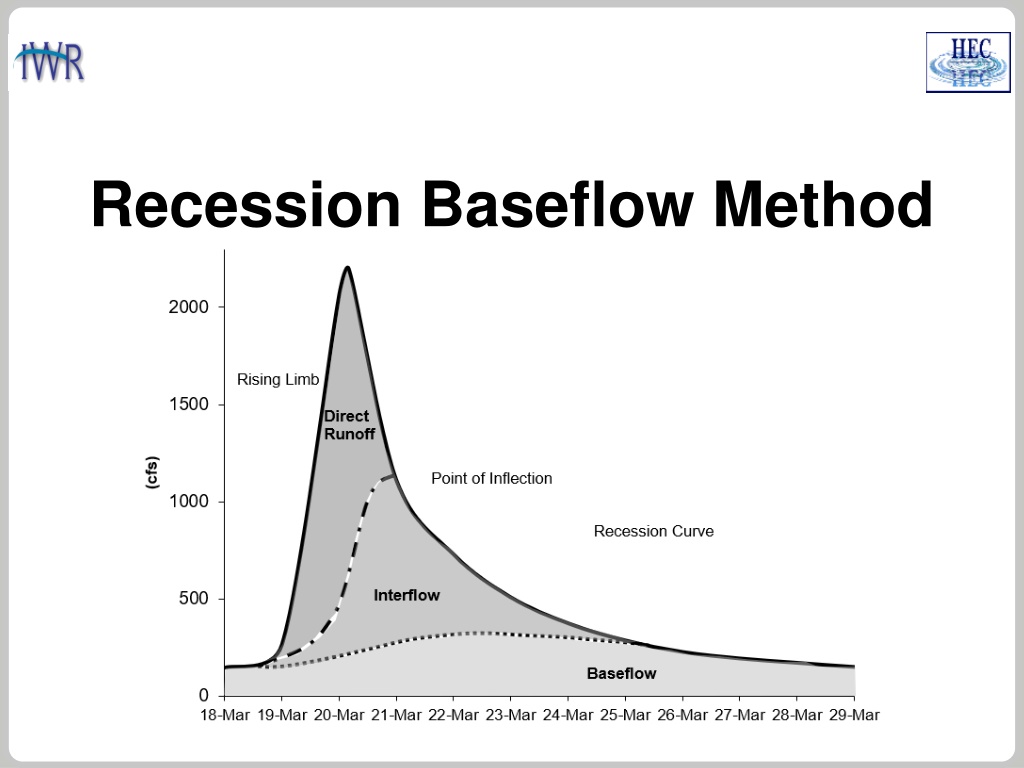
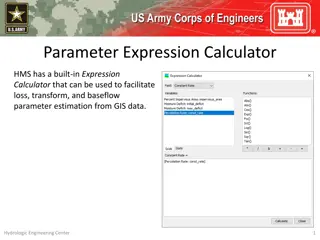
Recession Baseflow Method is a technique used in hydrology to model hydrographs' recession curve. This method involves parameters like Initial Discharge, Recession Constant, and Threshold for baseflow. By analyzing different recession constants and threshold types such as Ratio to Peak, one can effectively model baseflow components. The method acts as an event model, resetting between flood events, but it cannot represent both interflow and groundwater flow simultaneously.

Download Presentation

Please find below an Image/Link to download the presentation.
The content on the website is provided AS IS for your information and personal use only. It may not be sold, licensed, or shared on other websites without obtaining consent from the author. Download presentation by click this link. If you encounter any issues during the download, it is possible that the publisher has removed the file from their server.
E N D
Presentation Transcript
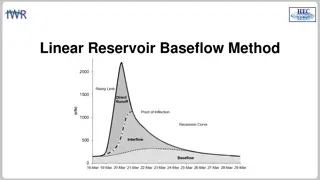
RECESSION BASEFLOW The recession baseflow method models a hydrograph s recession curve using the following equation: Qt= flow at time t Q0= flow at the beginning of the recession curve k = exponential decay constant T = time 2
RECESSION BASEFLOW Parameters for the Recession Baseflow Method: Initial Discharge (either specified as a rate or as a rate per area) Recession Constant Threshold for starting the baseflow recession curve (specified as a flow threshold or as a ratio to peak) 3
RECESSION BASEFLOW The plot on this slide shows results from three different recession constants. A recession constant closer to 1 results in a flatter recession curve, a constant closer to 0 results in a steeper recession curve. It is not possible to model both interflow and groundwater flow baseflow components using the recession baseflow method. Recession Constant 0.9 Notice the recession constant had little impact on the flood peak. The recession constant would impact a second flood event. 0.5 0.1 4
RECESSION BASEFLOW The recession curve turns on when the receding limb of the hydrograph falls below a threshold/trigger flow. You can choose a threshold type: ratio to peak or discharge (a ratio to peak of 0.5 means the threshold would be 50 cfs if the peak flow was 100 cfs). Ratio to Peak 0.9 Ratio to Peak is easier to apply across the basin model (generally consistent across subbasins), where a discharge threshold is dependent on subbasin size. 0.5 0.1 5
RECESSION BASEFLOW You can choose an initial discharge type: Discharge per Area or Discharge (a discharge per area of 1 CFS/MI2 means the initial flow would be 100 cfs for a 100 square mile subbasin). Discharge per Area is easier to apply across the basin model (generally consistent across subbasins), where a discharge initial type is dependent on the subbasin size. The plot on this slide shows different initial discharge per area values. Be strategic when setting the starting date of the simulation, reduce impacts from prior floods (only groundwater baseflow in the system). Initial Discharge 10 5 1 6
RECESSION BASEFLOW Computed Total Flow Computed Baseflow Observed Flow The recession baseflow method can be used for a continuous simulation. The method should be considered as an event model. The recession curve resets between flood events, as shown in the plot. The example on this slide also shows that the recession method cannot model both interflow and groundwater flow (there is only one recession constant). 7
RECESSION BASEFLOW Check the runoff volume when using the recession baseflow method to make sure the discharge volume does not exceed precipitation volume (there might be cases when this is ok) and computed volumes are similar to water balance studies in the region. There might be tendencies to artificially increase baseflow to improve the model performance when precipitation data do not capture the storm event. Applying the calibrated model to a hypothetical event with a much higher flood magnitude can cause unreasonable baseflow volumes. Reduce the ratio to peak for extreme hypothetical floods and check computed volume. 8