City Revenue and Economic Forecast Update for Fiscal 2023
Council Finance projects a mild recession and weak recovery, with tax revenues exceeding OMB's forecast but constrained by inflationary pressures. Despite economic challenges, FY23 tax collections are higher, driven by strong consumer spending and real estate activity.
Download Presentation

Please find below an Image/Link to download the presentation.
The content on the website is provided AS IS for your information and personal use only. It may not be sold, licensed, or shared on other websites without obtaining consent from the author.If you encounter any issues during the download, it is possible that the publisher has removed the file from their server.
You are allowed to download the files provided on this website for personal or commercial use, subject to the condition that they are used lawfully. All files are the property of their respective owners.
The content on the website is provided AS IS for your information and personal use only. It may not be sold, licensed, or shared on other websites without obtaining consent from the author.
E N D
Presentation Transcript
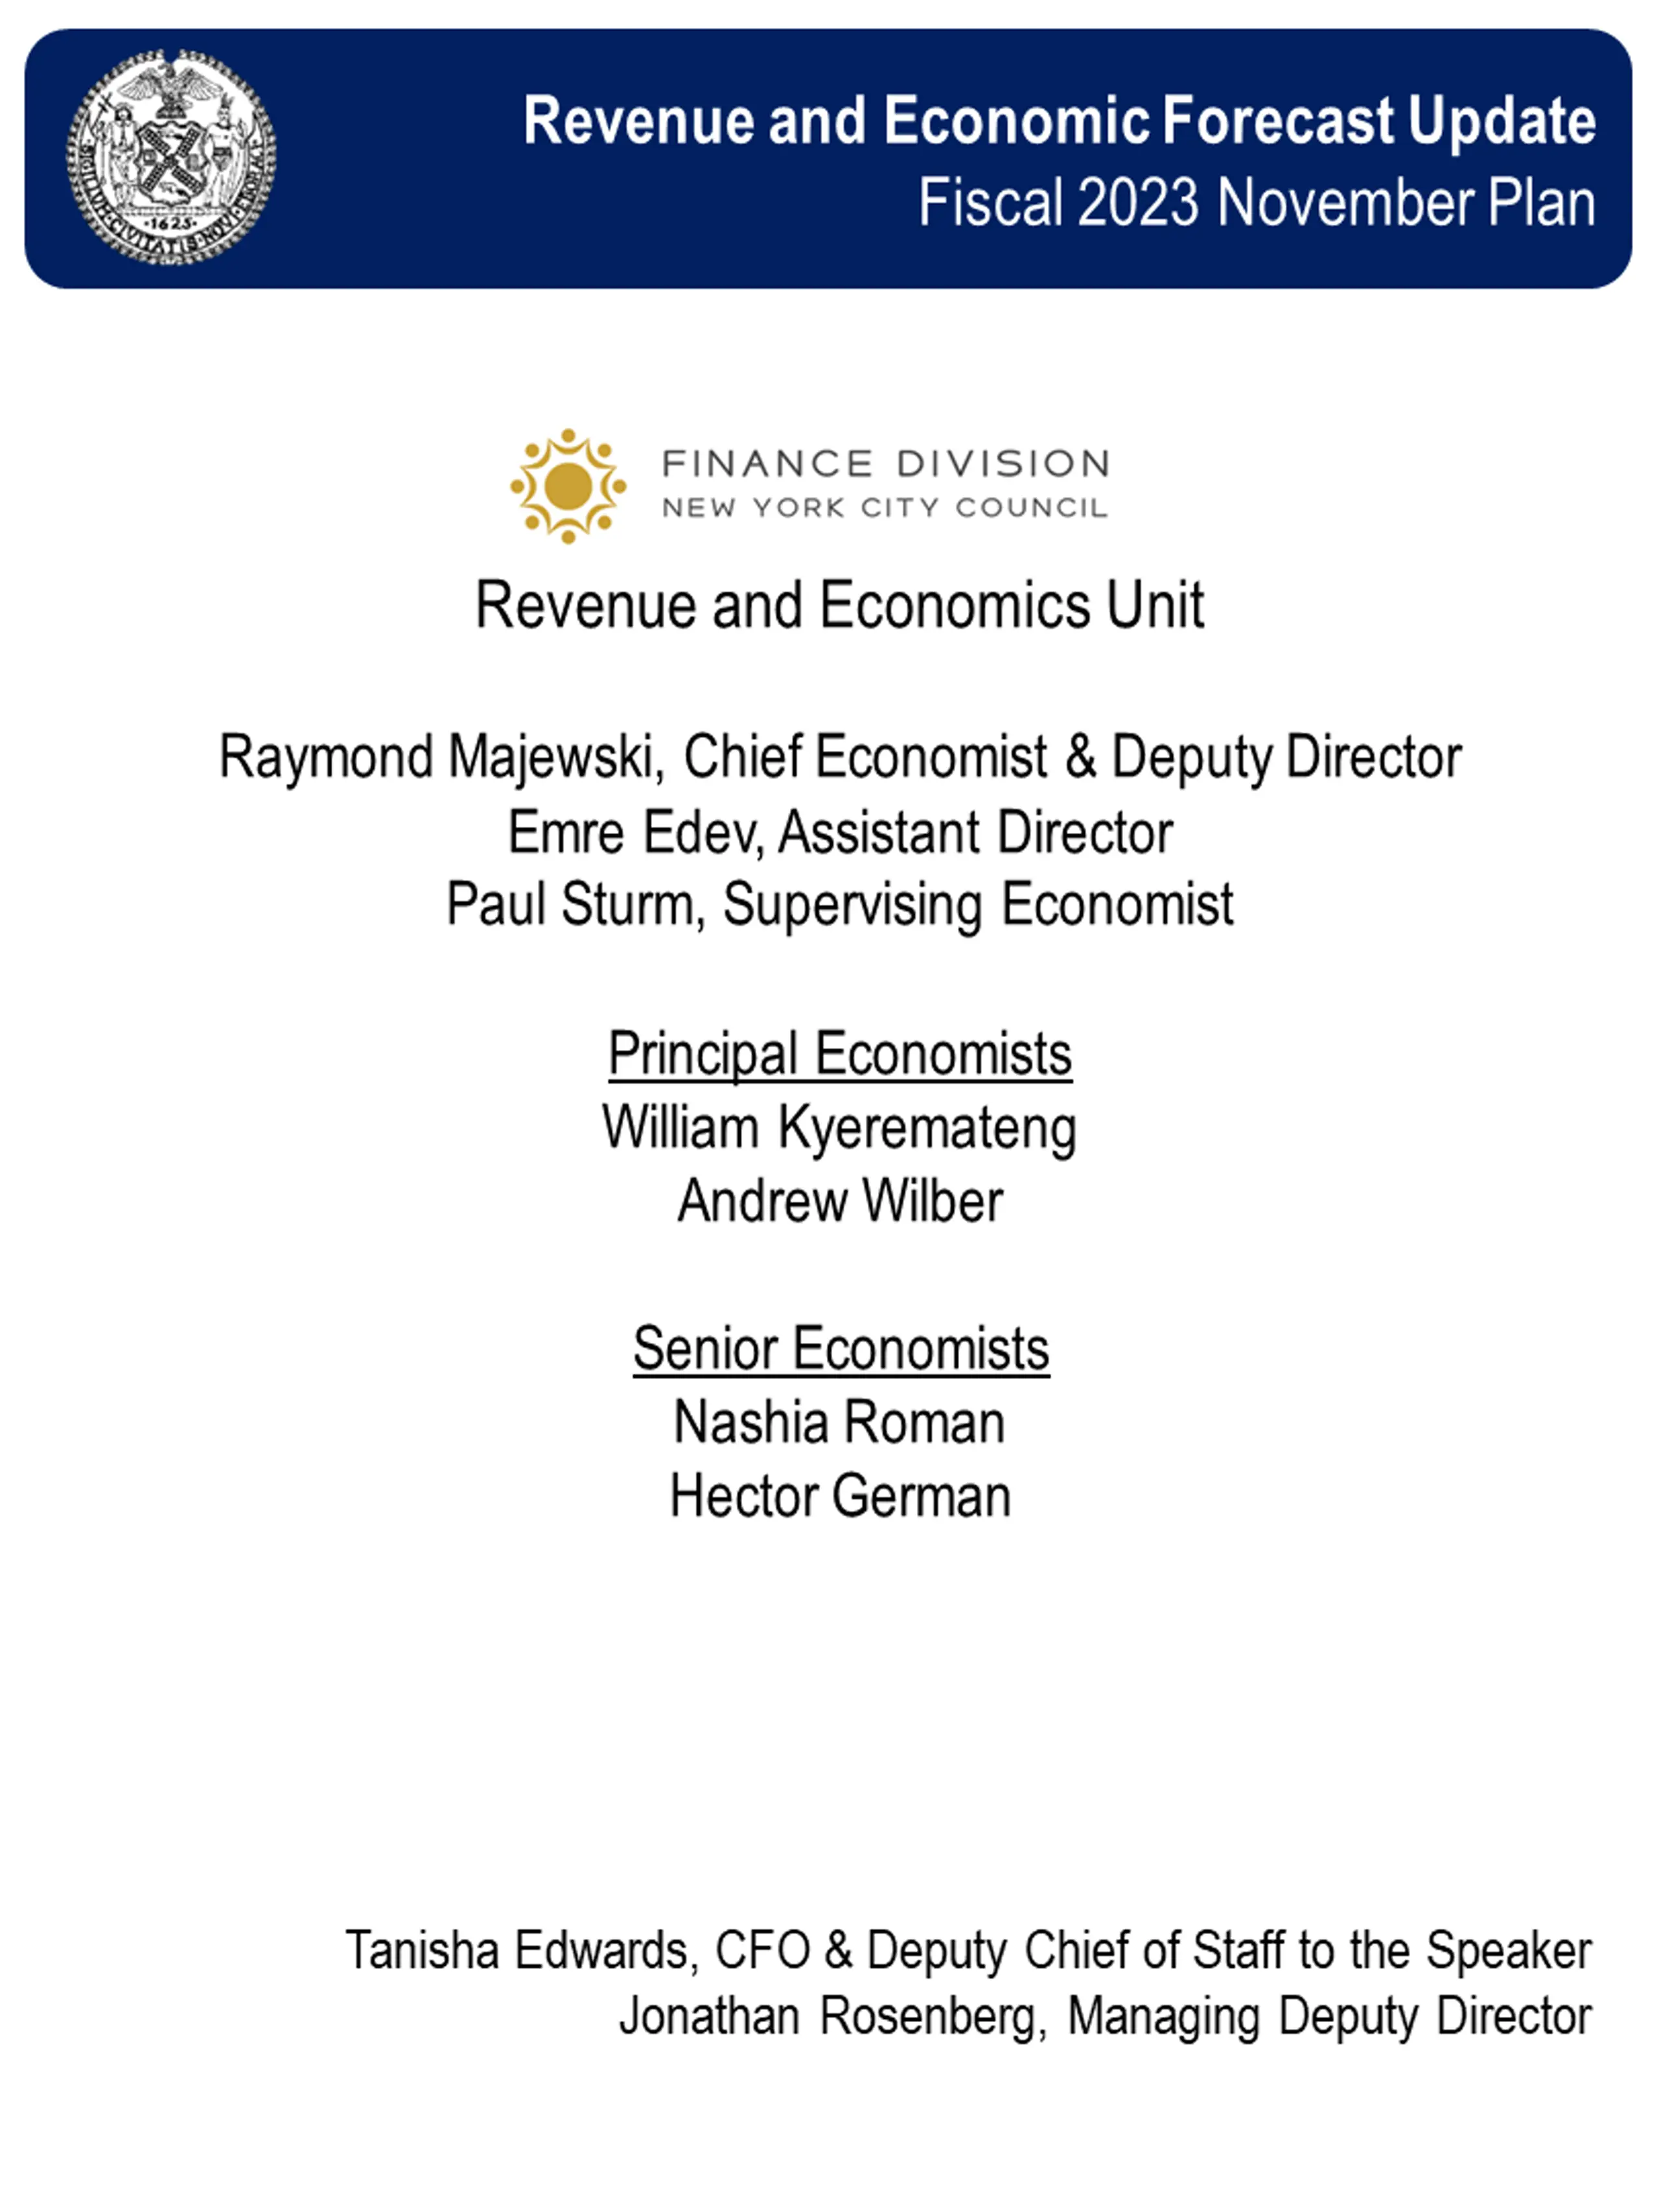
Revenue and Economic Forecast Update Fiscal 2023 November Plan Revenue and Economics Unit Raymond Majewski, Chief Economist & Deputy Director Emre Edev, Assistant Director Paul Sturm, Supervising Economist Principal Economists William Kyeremateng Andrew Wilber Senior Economists Nashia Roman Hector German Tanisha Edwards, CFO & Deputy Chief of Staff to the Speaker Jonathan Rosenberg, Managing Deputy Director
Overview Inflationary headwinds will constrain the City's Budget. Council Finance forecasts a mild recession followed by a weak recovery. The Council Finance tax forecast is well above that of OMB. However, inflation eats into the purchasing power of the City's taxes. Figure 2: FY23 Year-to-Date Tax Collections Figure 1: City Budget & Economics 22.5% % Above Same Time Last Year 20.7% FY23 Budget $104 Billion $2.9 Billion over FY23 Adopted Budget 11.9% 6.3% FY23 Tax Revenues (OMB) $67.7 Billion Unchanged since Adoption 2.1% Personal Income Sales Other Real Estate Property Business * Personal Income and Sales Taxes through October; all others through September Inflation (CPI-NYC MSA) 2022: 6.1% yr/yr IHS Markit forecast (Nov. 2022) YTD collections for FY23 are $2.8 billion higher than the same period last year, and $1.6 billion over OMB's Plan at Adoption. The strength of the current year s collections are attributable to higher-than-expected PIT withholdings and settlements, strong consumer spending driving the Sales Tax, and an influx in real estate activity boosting the Real Estate Transaction Taxes. Private Employment 2022: +268,300 jobs NYC Council Finance Division forecast Figure 3: Current Economic Conditions City Economy National Economy Employment shrunk by 2,500 positions in October, after adding 23,000 private sector jobs on average over the prior 12 months. Total jobs still 3.2% below the pre-COVID level (sea adj). Low-wage paying jobs still significantly below their pre-pandemic levels. After falling to 5.6% unemployment rate inched up to 5.9% in October. The labor force participation rate has recovered to 60.6% as of Oct. 2022. But the size of the labor force remains 7.3% less than its pre- pandemic level. Real GDP increased by a healthy 2.9% in 3Q 2022 annual rate following declines of 1.6% and 0.6% in 1Q and 2Q respectively. Consumer spending maintained momentum, expanding by 1.7% in 3Q 2022. Consumer Price Index has fallen to 7.7% growth yr/yr in October - down from 8.2% in September, and 9.1% at its June peak. The unemployment rate was 3.7% in November the same as in October close to September's record low of 3.5%. Nonfarm payroll employment expanded by 263,000 in November, less than the 392,000 monthly average in 2022, but above the 164,000 average in 2019. in September, the Inflation in NYC-Metro Area fell for a second successive month to 6% (yr/yr) in October. 1
Economic Forecast Local and national economic projections set the base for the Council s tax forecast. As presented in the following figures, the Council anticipates a mild recession followed by a weak recovery. Coupled with the current high-inflation environment, the City's budget continues to face economic pressure across the Financial Plan period. Figure 4: National Unemployment & GDP Rates Figure 5: NYC Private Sector Employment (In Thousands) 7% 4,200 6% 4,100 5% 4,000 4% 3,900 3% 3,800 2% 3,700 1% 3,600 0% 3,500 -1% 3,400 -2% 3,300 -3% 3,200 Unemployment Rate Real GDP Major economic indicators such as GDP and employment, are portraying a U.S. economy growing more slowly. Actual Forecast Private sector employment in NYC has generally remained strong and is projected to grow by 7.3% in 2022. The Federal Reserve's regimen of large interest rate hikes is slowly impacting business investment, output and eventually employment and consumption. Beyond this year, the labor market is expected to weaken, with employment having fallen by 1.4% in the 4Q 2023 compared to 4Q 2022. IHS Markit forecasts GDP growth to turn negative in the 4Q 2022 and continue to contract through the 2Q 2023. Employment is forecasted to contract in 1Q 2023 through 1Q 2024. The City will shed about 64,000 jobs (peak to trough) mild compared to previous recessions. The unemployment rate will climb from 3.7% in 4Q 2022 to a peak of 5.7% by 4Q 2023. GDP growth will return to 2.0% by 4Q 2026. Job growth will resume in 2Q 2024 through the end of 2026. Unemployment will only recover to 4.5% by 4Q 2026. 2
Tax Revenue Projections As shown in Figures 6-10, the Council's current forecast continues to exceed OMB's forecast, however not to a degree substantial enough to account for the current inflationary projections. Figure 6: Tax Revenue Forecast (Dollars in Billions) $77 $72 $67 OMB Finance Division Previous $62 FY21 FY22 FY23 FY24 FY25 FY26 Following the previous fiscal year s 6.2% growth in tax revenue, the Finance Division expects FY23 tax revenue growth to moderate to 0.7%. The slight uptick is mainly attributable to expected increases in property, sales, hotel and other minor taxes. Sizeable declines in the income-driven and property transaction taxes will offset most of the projected increases. Total collections will grow by a percent in FY24, reflecting projected increase in revenues from the property and hotel taxes. In contrast, the transaction taxes will see sharp declines, while the sales and income taxes experience marginal reductions in collections. Growth in tax revenues will accelerate to an average of 2.8% in FY25 and FY26. Figure 7: Current Council tax forecast compared with OMB s November Plan (Dollars in Millions) The Finance Division s FY23 tax forecast exceeds OMB s by about $2.3 billion, reflecting substantial differences in sales, property and property transaction taxes. FY26 $3,292 FY25 $2,426 The Finance Division projects stronger consumer spending compared to OMB. It also anticipates more moderate uncollectable property taxes and a gradual pace of decline in the transaction compared to OMB. FY24 $2,380 FY23 $2,321 3
Figure 8: Councils Inflation Adjusted Tax Forecast Tax Revenue Growth Turns Negative When Adjusted for Inflation While tax revenues will grow slowly during the forecast period, inflationary pressures will reduce their purchasing power. 72,498 74,809 Tax Revenue (million $) 80,000 70,766 70,071 75,000 69,597 70,000 In FY24, revenues will be 6.2% lower than in FY22, in FY22 dollars. 65,908 65,000 69,597 65,313 60,000 66,518 65,301 55,000 2022 2023 2024 2025 2026 Tax Forecast Adjusted for Inflation Figure 9: Council s Tax Forecast Levels (Dollars in Millions) Type of Tax Real Property Personal Income Business Corporate Unincorporated Sales Commercial Rent Real Property Transfer Mortgage Recording Utility Hotels All Others Audits Total Taxes FY23 FY24 FY25 FY26 $31,695 15,366 4,648 2,331 9,357 $32,857 15,314 4,584 2,317 9,298 $33,873 15,542 4,584 2,342 9,537 $34,616 15,875 4,592 2,354 9,920 902 1,615 1,273 402 597 1,085 800 $70,071 917 1,521 1,142 382 652 982 800 $70,766 947 1,644 1,177 382 691 979 800 $72,498 998 2,201 1,324 385 765 977 800 $74,809 Figure 10: Risks to Council s Tax Forecast Levels In these times of elevated uncertainties, several risks to the above forecast appear the most salient. Ukraine Russia Conflict Inflation and Slow Economic Growth China's Zero-COVID Policy Fed Rate Hikes Impacting Financial Markets Pace of Return to Manhattan Offices Strong Consumer Sentiment Revenue and Economic Forecast Update Fiscal 2023 November Plan 4
