Exploring the Critical Relationship Between Climate and Groundwater
Investigating groundwater as a vital global resource, this study delves into the profound impact of climate change on groundwater levels and quality. Highlighting challenges and solutions, it emphasizes the urgent need for sustainable groundwater management practices.

Uploaded on Oct 01, 2024 | 0 Views
Download Presentation

Please find below an Image/Link to download the presentation.
The content on the website is provided AS IS for your information and personal use only. It may not be sold, licensed, or shared on other websites without obtaining consent from the author. Download presentation by click this link. If you encounter any issues during the download, it is possible that the publisher has removed the file from their server.
E N D
Presentation Transcript
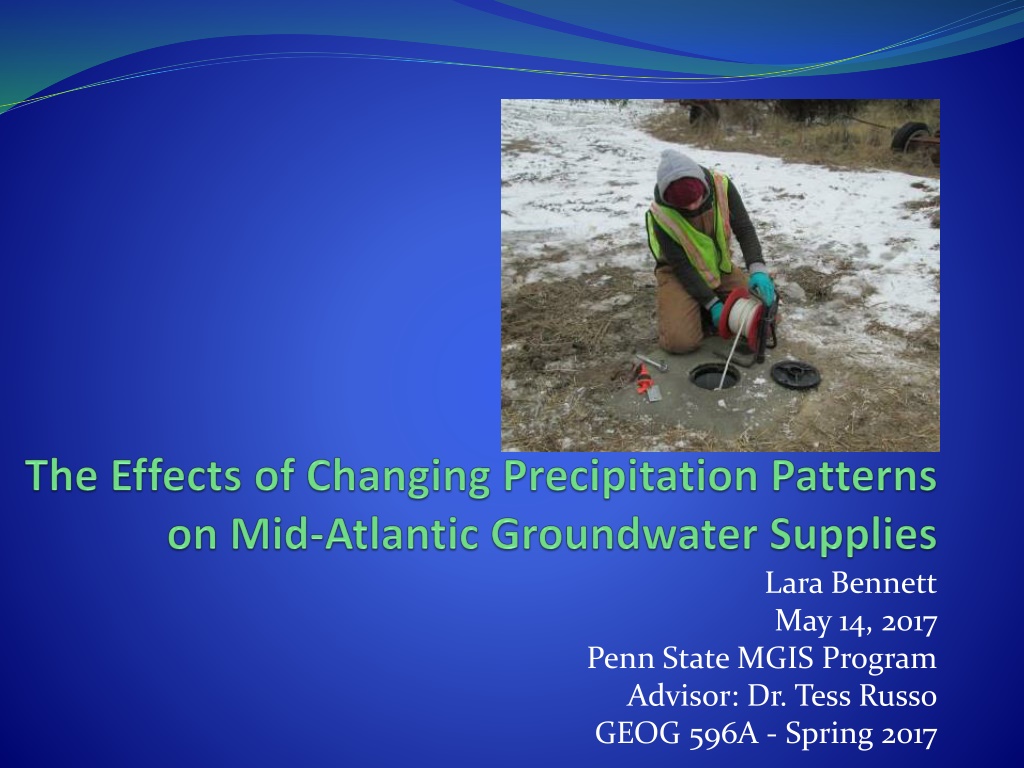
Lara Bennett May 14, 2017 Penn State MGIS Program Advisor: Dr. Tess Russo GEOG 596A - Spring 2017
Personal Background Background in hydrogeology Worked as an environmental consultant & state government contractor for 7+ years Chesapeake GeoSciences, Inc. Maryland Department of the Environment Specialized in monitoring and management of contaminated groundwater via Petroleum LNAPL and Chlorinated Solvents Completed PSU GIS certificate in Spring 2016 & began MGIS program
Overview I. Project Background A. Groundwater as a Resource B. The Connection between Climate & Groundwater II. Project Framework A. Objectives & Key Research Questions B. Study Area C. Data Sources D. Methodology E. Evaluation F. Example Analysis G. Challenges III. Result Applications
Groundwater: A Key Resource Groundwater accounts for more than 30% of the freshwater on Earth but makes up 94% of usable freshwater when excluding glaciers Globally, groundwater is utilized as the primary source of potable water for over 1.5 billion people In the United States, more than 50% of the population use groundwater as a drinking water source Irrigation makes up 70% of groundwater use Multiple studies show widespread groundwater storage decline across the United States in the last 3 decades (USGS Groundwater Resources Program, 2011) Source: (Konikow, 2011)
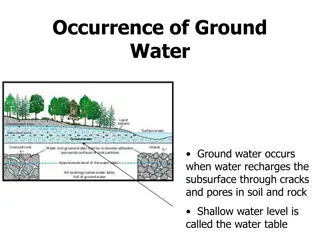
How Do We Obtain & Monitor Groundwater? Groundwater wells Often sourced from confined aquifers Aquifer capacity is dependent on soil porosity & permeability Groundwater is depleted when more water is discharged than recharged within an aquifer Source: (USGS, 2014) Source: (USGS, 2014)
The Connection Between Climate & Groundwater Climate change directly impacts annual temperature, precipitation patterns, and evapotranspiration cycle Results in impact to aquifer recharge rates over time Consequences include: Drought Waterlogging Resulting in Flooding Seawater Intrusion Groundwater Pollution Source: (Hansen, 2010)
The Connection Between Climate & Groundwater Paper published by Klove & al. in 2013 shows the correlation between changes in precipitation patterns, land use, and the effects they have on groundwater storage levels Source: (Klove, 2013)
Project Objectives & Key Research Questions What areas within the Northern Coastal Plain Aquifer have exhibited the most consistent correlation between groundwater elevations and precipitation patterns? Are there specific correlations between: Certain topographic features? Soil types? Land use types (i.e. agricultural, rural residential, urban)? What are the incrementally measured changes in groundwater elevation for shallow unconfined vs. deep confined local aquifers from dry to wet years (and visa versa)? Can a statistical coefficient be applied to measured changes to aid in predicting future impacts to groundwater supplies?
Anticipated Results Areas of shallow unconfined aquifers, low topography, & high porosity soils respond quickest to climate changes Areas of high irrigation & domestic well water use require shorter timescales to respond to precipitation variability Deep aquifers respond to extreme changes in precipitation at a slower rate, often responding to drastic changes in precipitation patterns over months rather than days Source: (Materson, 2016)
Why Focus on the Mid-Atlantic? Many US studies conducted in agriculture rich areas [the High Plains (Ogallala) Aquifer & the Gulf Coastal Plain] and areas of severe droughts [Central Valley in California & Western Alluvial Basins] Few if any direct studies on Mid- Atlantic region Highly populated area & growing Unique mixed water use Drastically changing groundwater levels over the last century Source: (USGS, 2011)
GIS Data Sources USGS Groundwater Historical Instantaneous Monitoring Well Depth to Water Level (~1950 2010) Maurer Gridded Observed Meteorological Data (Annual Precipitation Rasters) USGS 1 Meter DEMs USDA SSURGO Soil Type Shapefiles USGS National Land Cover Database (NLCD) Rasters ACWI National Groundwater Monitoring Network Aquifer Shapefiles
Proposed Methodology Map & Graph Ground- water Elevation Gradients Point Pattern Analysis Overlay Analysis & Evaluation Applications Time Series & Trend Analysis Utilization of regression model for assignment of groundwater protection area & decision making Years of Extreme Drought Years of Extreme Flooding Years of High Precipitation Identify Control MW Points Grouped by Topography Research Regression Models Develop Correlation Coefficients Yearly Average Groundwater Elevations Average Daily Precipitation per Year Groundwater Elevation Gradients NLCD Maps Soil Map DEM
Analysis Methods Point Pattern Analysis on Depth to Groundwater Levels for Years of Interest Kriging IDW Nearest Neighbor Distance Map Groundwater Elevation Gradients for Years of Interest DEM Create polygon layers to distinguish between different groundwater elevation zones Overlay Analysis For each year of interest overlay precipitation averages, soil types, & land use rasters onto groundwater elevation zones Identify & subcategorize areas based on types of soil, land use, and precipitation impacts Time Series & Trend Analysis of Temporal Datasets Compare significant yearly results from overlay analysis in each decade from ~1950-2010 Define areas of significance (i.e. areas that show significant response to precipitation patterns in years of high and low precipitation) Select key spatial control points within areas of significance Graph groundwater elevation changes for each control point over each decade (Tripathi, 2006)
Evaluation Define historical trends for various types of parameters & map high risk areas Unconfined vs. confined aquifers Agricultural land use Urban land use High elevation topography Low elevation topography Soil types If time permits, calculating coefficients for prediction Regression Analysis (Risley, 2008) Multiple Regression vs. Geographically Weighted Regression (GWR) Control Point Groundwater Elevations = Dependent Variable Source: (Bayramov, 2011) Source: (Risley, 2008)
Example Kriging Analysis 1980 (Intense Drought Year)
Example Kriging Analysis 1985 (High Precipitation Year)
Challenges Data Resolution Spatial Gaps & Localization of Data Incomplete & Spotty Groundwater Elevation Data Data Collection Errors
Result Applications Utilize historical findings to map areas at high risk of flooding and/or drought Implement notification system for high risk areas Create web application for assisting with predicting impacts to localized aquifers Users: Hydrologist, Farmers, Urban Planners Apply findings to further studies of localized aquifer yields via incorporation of pumping and discharge rates of irrigation and domestic well use
Capstone Timeline May 2017 Summer 2017 January 2018 February 2018 March 2018 April 2018 Fall 2017 Peer Review Presentation on 5/14/17 Edit & Revise Based on Feedback by Beginning of June Data Collection & Processing Research Regression Models Data Analysis Submit Abstract by 11/17/2017 Finish Data Analysis Evaluation of Results Application of Regression Model Prepare & Finalize Presentation Present at American Association of Geographers (AAG) Conference April 10-14, 2018
References Bayramov, E., Buchroithner, M., and McGurty, E. Determination of main climate and ground factors controlling vegetation cover regrowth along oil and gas pipelines using multiple, spatial and geographically weighted regression procedures. Environmental Earth Science, July 27, 2011: 2047-2062. Hansen, J., Ruedy, R., Glascoe, J., and Sato, M. GISS Analysis of Surface Temperature Change. Journal of Geophysical Research, 1999 (Updated 2010): 104, 30997-31022. Klove, B., Ala-Aho, P., Bertrand, G., Gurdak, J., Kupfersberger, H., et al. "Climate Change Impacts on Groundwater and Dependent Ecosystems." Journal of Hydrology, June 27, 2013: 250-266. Konikow, Leonard. "Contribution of global groundwater depletion since 1900 to sea-level rise." Geophysical Research Letters, September 2, 2011. Materson, J., Pope, J., Fienen, M., Monti, J., Nardi, M. and Finkelstein, J. Assessment of Groundwater Availability in the Northern Atlantic Coastal Plan Aquifer System from Long Island, New York, to North Carolina. Reston, VA: USGS Science Publishing Network, May 31, 2016. Risley, J., Stonewall, A., and Haluska, T. Estimating Flow-Duration and Low-Flow Frequency Statistics for Unregulated Streams in Oregon. USGS Scientific Investigation Report, 2008. Russo, T., Alfredo, K., and Fisher, J. "Sustainable Water Management in Urban, Agricultural, and Natural Systems." Water, December 12, 2014: 3934-3956. Russo, T., and Lall, U. "Depletion and response of deep groundwater to climate-induced pumping variability." Nature Geoscience (Macmillan Publishers Limited, part of Springer Nature) 10 (January 23, 2017): 105-110. Tripathi, S., Srinivas, V., and Nanjundiah, R. "Downscaling of precipitation for climate change scenarios: A support vector machine approach." Journal of Hydrology, April 14, 2006: 621-640. USGS. "Groundwater Basics." USGS. January 2, 2014. https://pubs.usgs.gov/of/1993/ofr93-643/ (accessed April 29, 2017). USGS Groundwater Resources Program. Assessing Groundwater Availability in the Northern Atlantic Coastal Plain Aquifer System. USGS, February 2011. USGS Office of Global Change. Effects of CLimate Variability and Change on Groundwater Resources of the United States. Idaho Falls, Idaho: USGS, September 2009.
Questions? Email: lqb5349@psu.edu / Phone: (314) 570-3551