The Intriguing Relationship Between Earth's Rotation, Geomagnetism, and Climate

High correlations between Earth's rotation and climate variables have been observed at multidecadal time scales, sparking questions about a common origin. This study explores the potential causality between geomagnetism, length-of-day variations, and climate, searching for significant correlations and "hot spots" on Earth's surface. Utilizing data on length-of-day variations, geomagnetic field coefficients, sea surface temperature, surface air temperature, and cloud cover, the analysis reveals interesting correlations between these factors, shedding light on a possible intricate link between Earth's dynamics and climate phenomena.

Download Presentation

Please find below an Image/Link to download the presentation.
The content on the website is provided AS IS for your information and personal use only. It may not be sold, licensed, or shared on other websites without obtaining consent from the author. Download presentation by click this link. If you encounter any issues during the download, it is possible that the publisher has removed the file from their server.
E N D
Presentation Transcript
The intriguing relation between Earth's rotation, geomagnetism, and climate at multidecadal time scales S bastien Lambert SYRTE, Observatoire de Paris - Universit PSL, CNRS, Sorbonne Universit , LNE 1
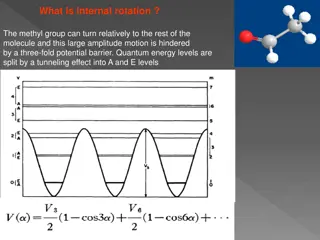
Outline High correlations between length-of-day (LOD) and climate variables (sea- surface temperature, surface air temperature, sea level) have been pointed out in numerous studies (e.g., Lambeck and Cazenave 1976, Dickey et al. 2011, Marcus 2016) at both decadal and multidecadal time scales. They raise the question of a common origin of the LOD and climate variations. Since multidecadal LOD is attributed to torsional flows in the core (Hide et al. 2000, Gillet et al. 2019), and, some authors suggested that correlated climate variations could result from modulation of incoming cosmic ray flux by Earth's magnetic field through cloud formation (Dickey et al. 2011). I propose here to check correlations between multidecadal LOD, Earth dipolar magnetic field, and some climate variables in order to Confirm results of previous studies about a possible causality between geomagnetism, LOD, and climate and Search for 'hot spots' at the Earth surface where the correlation are the most significant. The location of these 'hot spots' could give more insights into the nature of the link between LOD and climate. Time series of LOD variation derived from core flow (obtained from https://geodyn.univ-grenoble- alpes.fr; Gillet et al. 2019). Multidecadal variations of standardized series of LOD, SST, surface air temperature (SAT), sea level and cloud cover. 2
Data and methods Earth s rotation IERS C02 series. Sea surface temperature NOAA Extended Reconstructed Sea Surface Temperature (ERSST) v5 (Huang et al. 2017) monthly grids of sea surface temperature. Atmosphere NOAA-CIRES-DOE Twentieth Century Reanalysis (V3; Compo et al. 2011) monthly grids of surface air temperature and top, middle, and low cloud layer coverage. Geomagnetism Geomagnetic field (MF) coefficients g10 (along z), g11 (along x), and h11 (along y), total intensity, latitude and longitude of the geomagnetic pole from COV-OBS-x1 (Gillet et al. 2015; https://geodyn.univ-grenoble- alpes.fr) The comparison is done over a common time span of 1860-2015. Each series is resampled at monthly intervals, then smoothed with a 7-yr window, and detrended. I used the Pearson correlation coefficient with a confidence interval computed following the null hypothesis of two independent AR1 processes. All plots, including animated gif for lagged correlations, are available at http://syrte.obspm.fr/~lambert/lodclimate. 3
Results Geomag / Climate LOD / Climate r lag Fz r lag Fz ----------------------------------------- AMP / SAT North Atlantic -0.69 -11.0 2.6 AMP / SAT North Pacific -0.61 -6.6 2.1 AMP / SAT N Hemisphere -0.64 -8.7 2.2 AMP / SST North Atlantic -0.66 -13.8 2.4 ----------------------------------------- LOD / SAT Global -0.70 -1.5 2.5 LOD / SAT North Atlantic -0.74 -2.2 3.0 LOD / SAT North Pacific -0.72 -0.5 2.9 LOD / SAT Indian Ocean -0.57 -2.9 2.0 LOD / SAT N Hemisphere -0.73 -0.8 2.9 Results retaining only correlations significant at 95%. AMP, LAT, LON: amplitude, inclination, and longitude of the magnetic dipole. AMP / LCC North Atlantic -0.56 25.9 2.0 SAT: surface air temperature. LOD / SST Global -0.70 -4.2 2.3 LOD / SST North Atlantic -0.82 -3.2 3.6 LOD / SST South Atlantic -0.63 4.5 2.1 LOD / SST North Pacific -0.77 -5.2 3.2 LOD / SST N Hemisphere -0.82 -3.8 3.5 AMP / TCC S Hemisphere 0.52 -10.4 2.3 TCC: top cloud coverage. LAT / SAT Global 0.80 0.0 2.6 LAT / SAT North Atlantic 0.67 0.0 2.2 LAT / SAT North Pacific 0.78 0.0 2.7 LAT / SAT Indian Ocean 0.80 0.0 2.9 LAT / SAT N Hemisphere 0.78 0.0 2.8 MCC: medium cloud coverage. LCC: low cloud coverage. LOD / LCC South Pacific -0.50 13.8 2.1 r: correlation coefficient. LOD / MCC Global 0.79 0.0 3.6 LOD / MCC North Atlantic 0.55 2.3 2.2 LOD / MCC South Atlantic 0.54 -1.7 2.1 LOD / MCC North Pacific 0.67 -0.2 3.3 LOD / MCC South Pacific 0.82 -3.3 3.8 LOD / MCC N Hemisphere 0.71 1.5 3.2 LOD / MCC S Hemisphere 0.78 -1.6 3.4 lag in year, negative if the left quantity precedes the right one. LAT / SST Indian Ocean 0.75 0.0 2.4 LAT / MCC South Atlantic -0.63 0.0 2.1 Fz: Fisher s score (number of standard deviations by which the Fisher coefficient differs from zero). LON / SST South Atlantic -0.69 20.5 2.0 LON / TCC North Atlantic -0.55 0.0 2.2 LOD / TCC North Pacific 0.61 -9.6 2.0 LOD / TCC South Pacific 0.76 -3.3 3.3 LOD / TCC Indian Ocean -0.68 -6.2 2.5 LOD / TCC S Hemisphere -0.47 46.0 2.1 4
Results: LOD vs SST In the correlation plots, the successive shaded areas around the black line represent the 68%, 95%, and 99% confidence intervals. In the correlation maps, only correlation significant at more than 95% are reported. In both, the lag is negative when LOD precedes SST. I confirmed here the significant correlations between LOD and SST concentrated along North Atlantic (see Marcus 2016) with a small lag of a few years. 5
Results: LOD vs middle cloud layer coverage I found significant correlations between LOD and middle cloud layer coverage (MCC) mainly for South Pacific and South Atlantic. 6
Discussion I confirmed the significant correlations between LOD and SST concentrated along North Atlantic (see Marcus 2016). I also found significant correlations between LOD and top/middle cloud coverage (TCC/MCC) occurring mainly for South Pacific and South Atlantic. The lag for which the correlation is maximum with a maximum significance is generally of few years in the sense of LOD variation preceding the cloud coverage variation. The highest correlations show up in South Pacific along a diagonal line from central Pacific to South Patagonia which is also the Pacific edge of the South Atlantic Anomaly. It suggests that the magnetic field variations that reflect the multidecadal core flow evolution could be at the origin of the cloud formation possibly through a modulation of the incoming cosmic ray flux (as proposed by Dickey et al. 2011). The correlation between climate data and the reconstruction of the magnetic field is less revealing, likely because the magnetic series are too smoothed with a loss of some spectral information (which is not the case of LOD whose spectral resolution is similar to the spectral resolution of the climatic data). Nevertheless, I detected significant correlations (~0.8, 95%) between the dipole latitude and surface air temperature. More work is needed to interpret these results. This study is based on correlation studies and, unfortunately, does not provide any solid scenario quantifying how much the magnetic field change can influence cloud nucleation, a mechanism still debated (Svensmark and Friis-Christensen 1997; Sun and Bradley 2002; Vieira and da Silva 2006; Courtillot et al. 2007; Svensmark et al. 2016). Moreover, this study does not consider external (astronomical) forcing like the solar magnetic field as possible source of modulation of the climate, its interaction with the Earth s magnetic field, and the astronomical mechanisms at the origin of the solar activity variations (Scafetta 2010; Mo rner 2012) in the frame of a cosmoclimatology (Svensmark 2007). 7
References G. P. Compo, J. S. Whitaker, P. D. Sardeshmukh, et al. The twentieth century reanalysis project. Quarterly Journal of the Royal Meteorological Society, 137(654):1 28, 2011. V. Courtillot, Y. Gallet, J.-L. Le Mou l, et al. Are there connections between the earth s magnetic field and climate? Earth and Planetary Science Letters, 253(3):328 339, 2007. J. O. Dickey, S. L. Marcus, and O. de Viron. Air Temperature and Anthropogenic Forcing: Insights from the Solid Earth. Journal of Climate, 24:569 574, Jan. 2011. N. Gillet, O. Barrois, and C. C. Finlay. Stochastic forecasting of the geomagnetic field from the cov-obs.x1 geomagnetic field model, and candidate models for ICRF-12. Earth, Planets and Space, 67(1):71, 2015. N. Gillet, L. Huder, and J. Aubert. A reduced stochastic model of core surface dynamics based on geodynamo simulations. Geophysical Journal International, 219(1):522 539, 2019. R. Hide, D. H. Boggs, and J. O. Dickey. Angular momentum fluctuations within the Earth s liquid core and torsional oscillations of the core mantle system. Geophysical Journal International, 143(3):777 786, 2000. B. Huang, P. W. Thorne, V. F. Banzon, et al. Extended reconstructed sea surface temperature, version 5 (ERSSTv5): Upgrades, validations, and intercomparisons. Journal of Climate, 30(20):8179 8205, 2019/05/29 2017. S. Jevrejeva, J. C. Moore, A. Grinsted, and P. L. Woodworth. Recent global sea level acceleration started over 200 years ago? Geophysical Research Letters, 35:L08715, 2008. K. Lambeck and A. Cazenave. Long term variations in the length of day and climatic change. Geophysical Journal of the Royal Astronomical Society, 46(3):555 573, 1976. S. L. Marcus. Does an Intrinsic Source Generate a Shared Low-Frequency Signature in Earth s Climate and Rotation Rate? Earth Interactions, 20(4):1 14, Jan. 2016. N.-A. Mo rner. Planetary beat, solar wind and terrestrial climate. Solar Wind: Emission, Technologies and Impacts, pages 47 66, 01 2012. N. Scafetta. Empirical evidence for a celestial origin of the climate oscillations and its implications. Journal of Atmospheric and Solar-Terrestrial Physics, 72(13):951 970, 2010. H. Svensmark and E. Friis-Christensen. Variation of cosmic ray flux and global cloud coverage a missing link in solar-climate relationships. Journal of Atmospheric and Solar-Terrestrial Physics, 59(11):1225 1232, 1997. H. Svensmark. Cosmoclimatology: a new theory emerges. Astronomy and Geophysics, 48(1):1.18 1.24, 2007. J. Svensmark, M. B. Enghoff, N. J. Shaviv, and H. Svensmark. The response of clouds and aerosols to cosmic ray decreases. Journal of Geophysical Research: Space Physics, 121(9):8152 8181, 2019/05/16 2016. B. Sun and R. S. Bradley. Solar influences on cosmic rays and cloud formation: A reassessment. Journal of Geophysical Research: Atmospheres, 107(D14):AAC 5 1 AAC 5 12, 2002. L. E. A. Vieira and L. A. da Silva. Geomagnetic modulation of clouds effects in the southern hemi- sphere magnetic anomaly through lower atmosphere cosmic ray effects. Geophysical Research Letters, 33(14):n/a n/a, 2006. L14802. 8