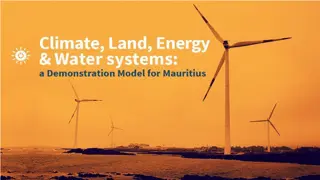
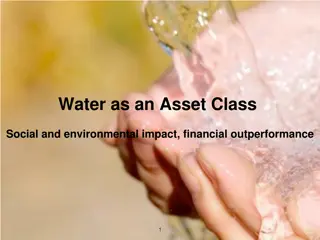
Investment Responses to Biophysical Climate Impacts on Water, Energy, and Land in SDGs and Climate Policies
Investment assessments using Integrated Assessment Models (IAMs) are evolving to include biophysical climate impacts, assessing climate uncertainty on investments. The approach involves the MESSAGEix-GLOBIOM IAM, considering climate policy, SDG measures, and impacts under different scenarios. Climate forcing, water supply reliability, and energy supply/water infrastructure investments to achieve Wellbeing, Energy, and Land (WEL) SDGs are discussed. Water investments breakdown shows climate uncertainty leading to cost increases to meet WEL SDGs.

Download Presentation

Please find below an Image/Link to download the presentation.
The content on the website is provided AS IS for your information and personal use only. It may not be sold, licensed, or shared on other websites without obtaining consent from the author. Download presentation by click this link. If you encounter any issues during the download, it is possible that the publisher has removed the file from their server.
E N D
Presentation Transcript
IAM investment response to biophysical climate impacts on water, energy and land in SDGs and climate policies Adriano Vinca, Muhammad Awais, Edward Byers, Oliver Fricko, Volker Krey, Keywan Riahi International Institute for Applied Systems Analysis (IIASA) Sixteenth IAMC Annual Meeting 2023 Venice, Italy, 15 November 2023 1 May 10, 2024
Former investment assessments using IAMs do not include climate impacts Now several IAMs are detailed enough to include some biophysical climate impacts and assess climate uncertainty on investments Kulkarni et al., 2022. PLOS Sustain Transform 2
Approach: MESSAGEix-GLOBIOM IAM Climate policy SDG measures Climate impacts RCP 2.6, 6.0 Hydrology: Precipitation pattern/runoff, groundwater intensity Desalination potential Crop Yield changes Renewable energy Cooling/heating demand Thermal power plant cooling capacity Food Water constraints, piped water access, wastewater treatment Energy Maximized electrification, phase-out traditional bio, cooling gap Life on land Protected natural land (>30%) Heathy (EAT-Lancet) diet, reduce food waste Efficiency improvements, environmental flow 2.6 W/m2 target Based on: ISIMIP 2b (Frieler et al. 2017 ),Byers et al., 2018, Gernaat et al., 2021 etc.) Based on: Doelman et al. 2022, MESSAGE-ACCESS, Van Vuuren et al., 2019, Parkinson et al., 2019, Frank et al., 2021, Hasegawa et al., 2015, Pastor et al., 2019
Climate Forcing (W/m2) Water supply reliability Scenario SDGs Impacts SSP2-noCF 6.0 No additional effort Frozen to 2020 Low-Med-High* SSP2-CF 6.0 No additional effort Low-Med-High SSP2-SDG-noCF 6.0 Frozen to 2020 Low-Med-High SSP2-SDG-CF 6.0 Low-Med-High SSP2-26-SDG-CF 2.6 Low-Med-High SSP2-26-CF 2.6 No additional effort Low-Med-High * Low = average values of multi-annual monthly distribution Med = 70th percentile High = 90th percentile SSP2 Middle of the Road Socio Economic Pathway CF Climate Feedback
Energy supply and water infrastructure investments to achieve WEL SDGs Limitation: SDG7* Energy access & clean cooking demand side costs not taken into account. Soft-link to MESSAGE- Access-E-use Literature estimates SDG 2,15: Clear benefits in energy and water investments. Less agriculture demand Our results SDG6: long-term higher costs than short term 5
Water investments breakdown Climate Uncertainty ? Cost increase to meet WEL SDGs World: +12% South Asia: +30% How much does it vary when including climate impacts?
Cost changes in the Energy supply and water infrastructure to meet WEL SDGs Regions with high water cost increase also have the highest climate change uncertainty, and the lowest adaptive capacity Climate Uncertainty
Cost changes in the Energy supply and water infrastructure to meet WEL SDGs Regions with high water cost increase also have the highest climate change uncertainty, and the lowest adaptive capacity Energy: Sub-Saharan Africa and South Asia have high energy investment increase
Cost changes in the Energy supply and water infrastructure to meet WEL SDGs Regions with high water cost increase also have the highest climate change uncertainty, and the lowest adaptive capacity Energy: Sub-Saharan Africa and South Asia have high energy investment increase Temporal dimension: long-term cost of maintaining the SDG targets is often higher and more uncertain than reaching the targets.
Climate mitigation Energy Supply investments Scenarios to limit temp. increase to 2DC Results fall in the lower range of previous estimates. Energy supply mitigation inv and O&M affected by max 20% by climate impacts. Impacts on energy in MESSAGEix- Nexus: Capacity factor of thermal power plants (low share in mitigation) Hydropower potential Electricity for water Cooling gap, not changing in our sensitivity 11
Conclusions Insights: SDG costs might vary up to 30pp because of climate change in the most stressed regions Maintaining long-term SDG targets might be more costly than reaching them, and highly impacted by climate Land SDG benefits for WE investments Limitations: Land cost assessment Model intercomparison complicated due to model differences Supply vs demand detail Climate impacts included: no floods and droughts Model temporal resolution Limited to two RCP climate scenarios Recommendations and way forward Coordinate among land IAM modellers to include investments in their outputs Improve demand side investment assessment in MESSAGEix Sensitivity on land-use models to improve robusteness of the results Solutions to represent seasonal impacts or higher temporal resolution Cover a continuous space of climate scenarios
IAM investment response to biophysical climate impacts on water, energy and land in SDGs and climate policies Thank you! Contact: Adriano Vinca vinca@iiasa.ac.at Sixteenth IAMC Annual Meeting 2023 Venice, Italy, 15 November 2023
MESSAGEix-GLOBIOM-Nexus National level Projections socio-economic drivers MAGICC simple climate model G4M spatially explicit forest management model Population Economy GLOBIOM integrated agricultural, bioenergy and forestry model socio- economic drivers EPIC agricultural crop model GHG and aerosol emissions air pollution emission carbon and biomass price GAINS GHG and air pollution mitigation model consistency of land-cover changes (spatially explicit maps of agricultural, urban, and forest land) energy structure MESSAGEix comprehensive energy system representation, covering all GHGs, integration across different modules demand response agricultural and forest bioenergy potentials, land-use emissions and mitigation potential + water requirements water availability iteration MACRO Aggregated macro-economic model CWatM global hydrological model service prices Transport vehicle stock, modal split, cost and value of time Buildings buildings stock, appliances, energy access Materials production and recycling of key materials Nexus Water and agriculture Limitation: GLOBIOM does not provide investment assessment of land-related infrastructure or practices
South Asia, India. Investments to meet WEL SDGs Variability in water extraction (pumping gw, desalinating, treating). Small variations in fossil and renewable electricity generation investments
Limited intra-regional variability on mitigation costs Impacts on energy in MESSAGEix-Nexus: Capacity factor of thermal power plants (low share in mitigation) Hydropower potential Electricity for water Cooling gap, not changing in our sensitivity
Water and Energy supply investment requirements with SDGs 7* 18
Water and Energy supply investment requirements with SDGs 6 19
Water and Energy supply investment requirements with SDGs 2 and 15 20
Timeseries and model comparison 21 May 10, 2024
Timeseries and model comparison 22 May 10, 2024
Climate impacts on business as usual May 10, 2024 23
Climate impacts on yield Similarities with IMAGE: Middle east yield increase, pacific asia yield losses. Higher changes in MESSAGE- GLOBIOM 24
2.6 impacts: crop production Land impacts still play a role, but not as much as in 6p0. The range was +- 50% 25
Decompose investment by 3 impacts Biggest contribution is the land impact (GLOBIOM) Cooling gap impact mostly affect Middle east and Central Asia Greatest water inv reduction in South Asia (90%). Related to huge agriculture production loss 26 Use 'Header & Footer - Date' to set second footer line
Land costs assessment: not investments Afforestation = missed revenue from timber production (timber price timber harvest cost) * forest land diff Fertilizer use Fertilizer cost * fertilizer consumption Irrigation (no info on the technologies) average irrigation cost(r,y) * irrigated land Crop production cost Production cost(cr) * production
Renewable water availability 28 Use 'Header & Footer - Date' to set second footer line
Power plant cooling Small % 29 Use 'Header & Footer - Date' to set second footer line
v Most significant change in is the water withdrawals for irrigation as adaptation strategy 30 Use 'Header & Footer - Date' to set second footer line
Crop production and land Very different sensitivity across the two models 31
Fertilizer use Important role of fertilizers in changing yields in the land sectors. NH3 nexus GLOBIOM- MESSAGE could be explicitly represented, in order to take into account energy needs 32