Quarter 1 FY2023/24 Organisational Performance Overview
Strong performance indicators were observed in Quarter 1 of FY2023/24, particularly in the tourism sector. Global tourist arrivals and foreign direct spending showed significant growth, with Africa and Europe leading the way. Domestic travel also thrived, surpassing pre-pandemic levels in both trips and spend. The report highlights achievements against the FY23/24 Annual Performance Plan, showcasing steady progress and areas for improvement.
Download Presentation
Please find below an Image/Link to download the presentation.
The content on the website is provided AS IS for your information and personal use only. It may not be sold, licensed, or shared on other websites without obtaining consent from the author. Download presentation by click this link. If you encounter any issues during the download, it is possible that the publisher has removed the file from their server.

Presentation Transcript
FY2023/24 QUARTER 1 ORGANISATIONAL PERFORMANCE REPORT Summary Presentation to Portfolio Committee on Tourism 31stOctober 2023
Contents Environmental Analysis 1 Quarter 1 Performance Against FY23/24 APP 2 Financial Performance 3 Human Capital 4 Governance 5 2
Strong Start to 2023: Global Tourist Arrivals Rise, Total Foreign Direct Spend Surges by 144% Tourist Arrivals: Africa accounted for 75% of tourist arrivals, totaling 2.6 million visitors. Europe closely followed with a 16% share. This reflects the continued prominence of African tourists and substantial European presence in international tourism. Total Foreign Direct Spend (TFDS) in Quarter 1 2023: Notable 144% increase, reaching R25.3 billion compared to the same period in 2022. Europe contributed the highest amount, R10.8 billion. Africa followed with R9.3 billion This underscores the significant economic impact of African visitors on the destination's economy. Source: Statistical Release P0351: Tourism and Migration, May 2023, Statistics SA 4
January to May 2023 saw domestic overnight trips exceed pre-pandemic levels as well as the levels of the first five months of 2022 by 28%. Cumulative Overnight Domestic Spend (2023 vs. 2022): Increased by 22%. Indicates a significant rise in spending on domestic trips. Average Overnight Spend (2023 vs. 2022): Increased by 22%. Suggests that South Africans embarked on more frequent trips and spent more during each excursion. Total Nights Spent Away from Home: Reached 52,2 million, an 18% increase from 2022. Demonstrates a growing trend of people spending more nights away from home. Source: South African Tourism Domestic Survey Average Length of Stay per Trip (2023 vs. 2022): Decreased by 8%. Reflects the global trend of travelers preferring shorter, more frequent trips over longer ones. 5
QUARTER 1 PERFORMANCE AGAINST FY23/24 APP Summary Report 6
FY23/24 Annual Performance Plan: Quarter 1 Performance FY23/24 FY22/23 Quarter Planned Targets Targets Achieved % Performance Year on Year Comparative Analysis 65% (24 targets achieved against 37 planned targets) 1 50 37 74% Quarter 1 Overall Performance Quarter 1 Programme Performance 74% 16 120% 14 9 14 100% 13 100% 4 100% 92% 12 12 11 80% 10 50 8 8 8 57% 8 60% 45% 6 6 37 40% 5 4 4 4 3 3 20% 2 1 0 0% Planned Targets Achieved Targets Significant Progress 1 2 3 4 5 Not Achieved % Achievement Due Achieved Significant Progress Not achieved % Achievement 7
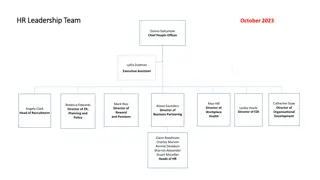
Overview of FY23/24 Quarter 1: Programme 1 Performance: Corporate Support Implemented the 3 recommendations arising from the FY2022/23 Risk Management Maturity Assessment Report including the review of the operational risk registers; linking the key risk indicators to the operational risk registers; and assigning risks to risk owners. Implemented the Quarter 1 milestones in Corporate Compliance Campaign including the development of the OPCA audit implementation plan, the establishment of the project steering committee and the inaugural project steering committee meeting. OPCA s objective is to ensure that the internal control environment is effective, efficient, and conducive to the entity obtaining favourable audit outcomes which could result in improved productivity and a clean audit within 24 months, by March 2026. Implemented 26% of valid audit recommendations exceeding the planned target of 25%. Paid 100% of compliant invoices within thirty days from date of receipt. Implemented initiatives to promote integrity and ethics in SCM including letters confirming budget allocation and related accountability issued to business unit managers, capability building for procurement committees and created awareness organisation-wide on the SCM code of conduct. The Budget Optimisation Strategy was not developed as planned as the approach and scope of work for this project was revised. Mitigating measures will be implemented in future quarters to achieve the annual planned target. An action plan was developed to address issues arising from the prior year s staff engagement assessment to improve levels of staff satisfaction. In terms of Employment Equity targets, SA Tourism achieved 65% women against a target of 60%, management positions in SA Tourism was achieved against a target of 50%, 0% people with disabilities (PwDs) are employed in SA Tourism against a target of 2%, and at least 75% Black people (Africans, Coloureds, and Indians across all occupational levels) against a target of 60%. The challenge with regards to women in senior and top management positions in SA Tourism is the moratorium that was in place during the quarter and an increase in resignations. In terms of PwDs, the challenge remains that disclosure is voluntary. Against the target of <8% Labour Turnover (LTO) as % of average headcount, the target was achieved at 3%. However, the business unit did not comply with the reporting requirements which led to under-performance. This has been corrected in Quarter 2. The quarterly target of <8% vacancies as % of staff establishment was not achieved with a performance result of 14% which is due to the moratorium. The performance result for the implementation of the Quarter 1 deliverables of the FY2023/24 roadmap of the ICT Governance Framework was not achieved due to the partial approval of the roadmap. This has been corrected in Quarter 2. 44% women in senior and top 8
Overview of FY23/24 Quarter 1 Programme 2 Performance: Business Enablement Two of the 8 planned Quarter 1 milestones as per the Year 2 Roadmap of the Integrated Digital and Analytics Operating Framework were recorded. The challenge in this regard was that the performance could not be verified. This was corrected in Quarter 2. The Departure Survey Fieldwork Report and the Domestic Tourism Survey Fieldwork Report were not produced as planned. Additional training was provided to the business unit to ensure optimal performance in Quarter 2. The 1 Quarterly Trend Analysis Report planned for the quarter was not published as planned. This was corrected through additional training for the business unit. Twenty-five thought leadership pieces were published against the target of 2, to showcase data on the 24 marketing prioritisation and investment markets, which was an emerging operational requirement. One Tourism Statistics and Performance Report was produced as planned. The improvement plan based on the FY2022/23 South African Tourism Corporate Brand Index was developed. The Quarter 1 improvement actions arising from the FY2022/23 South African Corporate Brand Index were not implemented due to a clash in dates with stakeholders and more preparatory time required for the planned initiatives. This has been corrected in Quarter 2. The Best Company to Work for Survey, or equivalent, for SA Tourism, to determine the organisation s baseline rating was not undertaken due to a lack of capacity in the business unit. FTCs will be considered to increase capacity. The FY2023/24 Global PR and Communications Annual Plan was developed and approve. The achievement may be attributed to effective business partnering within the entity. The Quarter 1 milestones of the FY2023/24 Global PR and Communications Plan were implemented, which may be attributed to increased collaboration with stakeholders. 9
Overview of FY23/24 Quarter : 1 Programme 3 Performance: Leisure Tourism Marketing The FY2023/24 Global Tourism Brand Campaign Plan (Live Again 2.0) was finalised. The primary focus of the campaign will be to sell the destination globally. The campaign will use interesting stories spanning exceptional people, places, and ways, to deliver the message of South Africa as an exceptional destination. Live Again 2.0 was launched at Africa s Travel Indaba on 9thMay 2023. Timeous planning and project management led to the achievement of the target. Two global tourism campaigns were localised in South Africa including the 30 Years of Freedom Campaign, through the celebration of Hugh Masekela s lifetime achievements, and the Indaba Brand Experience, which was curated through a 360 dome to showcase South Africa as an exceptional destination for both business and leisure travel. Two global brand collaborations and/or partnerships were secured, which included a MOU with the South African Tourism Services Association (SATSA) to strengthen relations between the public and private sector, and a brand ambassador agreement with Siya Kolisi. Based on the FY2023/24 Global Tourism Brand Campaign, the annual localised campaign concept and implementation plan for each hub was developed, except for the Asia and Australasia Region. This region did not achieve its target due to non-compliance with reporting requirements due to capacity constraints. The annual Africa localised campaign concept and implementation plan was developed. The objective of this campaign is to position South Africa as a friendly and welcoming destination that offers immersive authentic leisure experiences, underpinned by people, culture and value for money, while showcasing scenic beauty. This informed the 360 West Africa and Central, East, and Land brand campaigns 1 and 2 concepts. The annual seasonal campaign and implementation plan for domestic tourism was developed and approved, which seeks to inspire domestic segments to travel and take more day and holiday trips by showcasing a variety of affordable, desired experiences, in a clear and accessible way, supported by a personal safety message. The Sho t Left Travel Week Campaign Concept was then also developed and approved. Distribution channels are traditional and non-traditional trade, like media, influencers and corporates. Distribution channel initiatives are platforms that allow for engagement and communication to build destination awareness and interest and drive conversion. SA Tourism implemented 24 distribution channel initiatives during the quarter. The Global Trade Programme is critical to stimulate demand in our markets and grow trips from and within the country. South Africa must be sold effectively by both trade and channel to contribute to economic growth and support the sector s recovery. The Quarter 1 milestones of FY2023/24 Global Trade Plan were thus implemented including hosting an airlines pavilion at Africa s Travel Indaba; participating in the launch of the Proflight Zambia Route; and participating at the AviaDev 2023 Conference. The Global Advocacy Programme provides collective, active, and concerted support for positioning South Africa, particularly to drive a positive narrative of South Africa, and to address barrier issues. The Quarter 1 milestones of the Global Advocacy Programme were executed, including media coverage, attendance at key events, and profiling traveller experiences. The quarterly tourism economic impact communication activity is one that communicates to various stakeholders what the tourism sector performance has been for the quarter and the related economic impact of tourism. An opinion piece by the Minister of Tourism on the tourism sector performance in relation to tourism sector recovery was published. 10
Overview of FY23/24 Quarter 1: Programme 4 Performance: Business Events The Domestic and Global Business-to-Business (B2B) Campaign Plans were developed and approved. The domestic campaign aims to create awareness about the bid support programme, National Association Project and Corporate Project. The global campaign seek to promote the destination s exceptional sectors, its strength in being a key player and leader within the knowledge economy, exceptional infrastructure and hosting capabilities. 33 bid submissions were achieved as planned. These bid submissions are for destination South Africa to host international and regional business events within the destination as part of the bidding pipeline for the destination. 1 business event, the Tourism Investment Forum Africa, was hosted in Upington, which is classified as a VTSD, on 7thto 8thJune 2023. The event attracted 194 delegates and speakers from the African content, provided 38 job opportunities, with 8 SMMEs supported through the Sustainability Village. The Quarter 1 Business Events Bidding Impact Report was produced as planned, which is attributed to timeous finalisation of bidding data. This report is a data and insights report that outlines essential bidding performance for destination South Africa from a business tourism perspective. Africa s Travel Indaba (ATI) 2023 Reimagined was successfully hosted from 8thto 11thMay 2023, which attracted 8 688 attendees, 1 464 buyers, and saw 55 423 meetings being held. The Post-Show Economic Impact Study briefing for Meetings Africa (MA) 2023 was successfully concluded. This report will outline the economic impact which will determine the quality of the show as well as the economic investment undertaken by South African Tourism by direct investment in relation to the project, and ancillary projects. The entity planned for and participated at 2 international strategic platforms, namely, Arabian Travel Market (ATM): Over the course of 4r days, the stand sharers on the pavilion held 3 021 meetings with buyers, resulting in 860 leads for business events to be hosted in South Africa over the next 2 to 5 years. South African Tourism created a 231 square meter South Africa Pavilion and 1 sales staff desk. South African Tourism s worked with Provincial Tourism Authorities and Small Tourism Enterprise Association (STEA) SMMEs. The selection process considered the geographic location and products that are present in and understand the SMMEs being added to the platform. potential with 20 desks in recruiting market. This led to 5 Middle East Worldwide Exhibition for Incentive Travel, Meetings and Events (IMEX) Frankfurt: South African Tourism created a 251-square-meter South African Pavilion featuring 14 stand sharers and 3 sales desks. Over the course of 3 days, the stand sharers on the pavilion held 479 meetings with buyers, resulting in 153 leads for potential business events to be hosted in South Africa over the next 2 to 5 years. South African Tourism held various engagements with buyers over the 3 days, generating 23 leads with a combined estimated economic of R968m and using the exhibition to source potential buyers for Meetings Africa. 11
Overview of FY23/24 Quarter 1: Programme 5 Performance: Tourist Experience 4 053 establishments were graded against a target of 1 356. This is attributed to annual tourism grading cycle for individual properties. The 3 milestones of the grading model and TGCSA Value Proposition Roadmap were achieved for Quarter 1, including the TGCSA brand campaign launch, commencement of change management for the business model, and the development of the operational model. The achievement of the target is due to adequate planning and implementation. The intention of this area of work is to broaden the opportunities for the inclusion of emerging tourist products, experiences and accommodation. The Product Proposition was developed, which identifies tourism products (establishments, attractions and experiences) to match them to the brand of South Africa being an exceptional tourist destination with a variety of authentic and diverse tourism offerings that meets the demands of the tourist. The Three-Year Tourism Value Chain Strategy was developed. The objective of the strategy is to improve the quality of the visitor s experience across the different touchpoints of the tourism value chain. The strategy will be supported by a roadmap that will outline deliverables for each of the three years. 12
Financial Performance Revenue PROGRAMME APP ANNUAL BUDGET R'000 INCOME FORECAST BY 30 JUNE 2023 REVENUE R'000 % OF ACTUAL INCOME ON ANNUAL BUDGET % OF ACTUAL INCOME ON FORECAST INCOME TO DATE 124% REASONS FOR VARIANCE Tranfer from the Department of Tourism 1 344 672 474 953 586 683 44% The variance is due to conservative budgeting measures in line with the decision on the allocation transfer. Revenue is recognised based on approval from the Tourism Business Council of South Africa, no revenue has yet been received in the quarter. Fees recognised for the quarter is a factor of fee paying graded establishment . The variance is due to lower number of graded established in the quarter Sundry revenue includes interest generated from a favourable bank balance in the first quarter. TOMSA voluntary levies 53 972 13 493 - 0% 0% Grading Revenue 13 211 3 025 674 5% 22% Sundry Revenue 62 980 7 152 8 577 14% 120% 40% 120% TOTAL REVENUE 1 474 835 498 623 595 934 14
Financial Performance Expenditure by Programme Programme Annual Budget R'000 EXPENDITURE FORECAST BY 30 JUNE 2023 EXPENDITURE R'000 %EXPENDITURE ON ANNUAL BUDGET % OF ACTUAL EXPENDITURE ON FORECAST EXPENDITURE TO DATE 121% REASONS FOR VARIANCES Corporate Support 161 718 68 198 82 812 51% The year to date variance includes underspending in compensation for employees due to vacancies, however is offset by rental paid upfront as per contractual obligations, and non cash items such as depreciation and amortisation. The overspending is due to brand tracking services and global subscriptions which have been commited as per contractual obligations. Buddget is available later in the year. The variance is attributable to higher unrealised foreign exchange transactions. The variance is due to increased sale events which require upfront commitment, the budget will be available later in the year. The variance is due to overspend in media production. Business Enablement 88 421 21 821 35 074 40% 161% Leisure Tourism Marketing 910 502 271 657 318 380 35% 117% Business Events 221 746 114 497 136 726 62% 119% 27% 109% Visitor Experience 92 448 22 450 24 520 41% TOTAL 1 474 835 498 623 597 513 120% 15
Financial Performance Expenditure by Economic Classification ECONOMIC CLASSIFICATION ANNUAL BUDGET EXPENDITURE FORECAST BY 30 JUNE 2023 EXPENDITURE % OF % OF ACTUAL EXPENDITURE ON FORECAST EXPENDITURE TO DATE REASONS FOR VARIANCES EXPENDITURE ON ANNUAL BUDGET Compensation of employees 261 106 60 471 57 076 22% 94% The underspending is due to vacancies which results in underpending as per budgeted organogram The overspend in good and services is attributable to overspending in Programme 2,3,4 and 5 Goods and services 1 213 729 438 152 540 437 45% 123% TOTAL EXPENSES 1 474 835 498 623 597 513 41% 120% 16
Financial Performance Analysis of Goods and Services 6% 11% Media Production Activation Total Travel Expenses Hosting Capabilities Research 31% 6% 1% 23% 22% 17
Human Capital Management: Employment Equity Male Female Foreign Occupational Level Top Management Senior Management Professionally Qualified Skilled Semi-Skilled Unskilled and defined decision-making Total Permanent Contract Labour (including interns) Grand Total African Coloured Indian Chinese White Subtotal African Coloured Indian Chinese White Subtotal Male Female Subtotal Total 0 0 0 0 0 0 1 4 1 0 0 1 6 4 21 0 1 0 2 24 27 9 1 1 0 2 13 25 4 0 0 0 0 4 8 0 0 0 0 0 0 0 38 2 2 0 5 47 65 4 0 0 0 0 4 8 42 2 2 0 5 51 73 0 2 4 4 0 0 0 1 3 3 0 0 7 0 7 0 1 0 0 0 0 1 0 1 0 0 3 3 0 0 6 0 6 1 8 0 0 7 5 0 0 0 0 0 0 1 14 79 64 12 0 170 12 182 37 35 8 0 89 8 97 11 11 0 0 22 0 22 18 16 0 0 34 0 34 10 0 10 12 0 12 19
GOVERNANCE 20
Board Meetings Name Number of Meetings Date of Meetings 5thMay 2023 6thMay 2023 9thMay 2023 22ndMay 2023 29thMay 2023 2ndJune 2023 5thJune 2023 23rdJune 2023 29thJune 2023 SA Tourism Board Quarter 1: 9 Marketing and Commercial Committee TGCSA Awards Committee Human Capital and Remuneration Committee Audit and Risk Committee Quarter 1: 1 24thMay 2023 Quarter 1: 0 n/a Quarter 1: 0 n/a Quarter 1: 1 29thMay 2023 21
THANK YOU THANK YOU 22