SITA Annual Performance Plan
 undefined


S
I
T
A
A
n
n
u
a
l
P
e
r
f
o
r
m
a
n
c
e
P
l
a
n
F
Y
2
0
2
2
-
2
0
2
3

Presented by: Managing Director (Interim)
M
r Luvuyo Keyise


SITA STRATEGY 2020/21 – 2024/25


Vision Statement
To be the leading information and communications
technology (ICT) agency in public service delivery.


Mission Statement
“To render an efficient and value-added ICT service to the public
sector in a secure, cost effective and integrated manner, contributing to
service delivery and citizen convenience.”


I
n
i
t
i
a
l
S
t
a
t
e
o
f
t
h
e
O
r
g
a
n
i
z
a
t
i
o
n


1.
51% customer satisfaction level
2.
0% core public facing services on digital
platforms
3.
Level 1 digital infrastructure as per the
digital government maturity model.
4.
(No baseline)
5.
-1% profitability
6.
10 % of black SMME's suppliers in SITA


1.
Seamless integrated and trusted public
services
2.
Increased citizen value through availability
& accessibility of core government public
facing services on digital platforms
3.
Optimised digital infrastructure
4.
Enhanced workforce capability solving
complex problems and adopting innovative
solutions
5.
Innovative digital service investments
promoting financial sustainability
6.
Reshaping the supply chain through ICT
economic transformation.


1.
60% customer satisfaction level
2.
40% core public facing services available on
digital platforms
3.
Attain maturity level 2 digital infrastructure
as per the digital government maturity model
4.
50% digitally capable workforce
5.
3% increase in profitability
6.
50% of black SMME's suppliers in SITA


T
a
r
g
e
t
S
t
a
t
e
o
f
t
h
e
O
r
g
a
n
i
z
a
t
i
o
n
–
3
-
y
e
a
r
t
a
r
g
e
t


Strategic
initiatives and
Projects:


Customer centricity
Innovation
Integrity

Agility
Collaboration
Empathy

Values


O
u
t
c
o
m
e
s


D
i
g
i
t
a
l
C
a
p
a
b
i
l
i
t
i
e
s

Research
Innovation and
localization

Cyber &
Information
Security

Electronic
Government

Modernization
of legacy
systems:

Reformed
Procurement

Provincial and
Local
Government
Digitalization

Cloud
Computing

Achieve:
D
i
g
i
t
a
l
T
r
a
n
s
f
o
r
m
a
t
i
o
n
f
o
r
i
n
t
e
r
n
a
l
S
I
T
A
e
n
v
i
r
o
n
m
e
n
t
a
n
d
C
l
i
e
n
t
e
n
v
i
r
o
n
m
e
n
t

2


A
l
i
g
n
m
e
n
t
t
o
M
T
S
F
a
n
d
D
C
D
T
o
u
t
c
o
m
e
s

SITA in consultation with DCDT alignment its APP targets with DCDT outcomes to ensure seamless implementation of government priorities.
A
l
i
g
n
m
e
n
t
t
o
M
T
S
F
a
n
d
D
C
D
T
o
u
t
c
o
m
e
s
(
c
o
n
t
.
)
SITA in consultation with DCDT alignment its APP targets with DCDT outcomes to ensure seamless implementation of government priorities.
S
u
m
m
a
r
y
o
f
k
e
y
s
i
t
u
a
t
i
o
n
a
l
a
n
a
l
y
s
i
s
c
o
m
p
o
n
e
n
t
s
The COVID-19 pandemic which is persisting for nearly two years has
profoundly impacted the digital landscape of South
Africa (SA) and by default still positively impacts SITA’s strategic direction.
The overall result is that the general need by citizens to access government services through digital platforms is more
prominent than ever before which
compels government to embrace the accelerated pace of digital transformation and
adopt new technologies.
There is therefore an urgency to accelerate the implementation of policies and programmes aimed at bridging the digital
divide
which is also highlighted as a contributing factor to worsening the socioeconomic status of SA.
The ICT sector remains an enabler of growth and job creation; therefore, SITA’s role as an organ of state becomes more
apparent and very relevant within the context of the Fourth Industrial Revolution.
SITA will leverage the existing appetite for digital technologies in partnership with the ICT ecosystem to augment its
capability to meet the customers demands while also adopting a pricing model that considers diverse customer needs.
In alignment to SITA annual integrated outcome - based planning approach which is guided by the revised DPME
planning framework for Strategic Plans (SPs) and Annual Performance Plans (APPs), the strategic planning process was
implemented as an organisational activity.
S
u
m
m
a
r
y
o
f
k
e
y
s
i
t
u
a
t
i
o
n
a
l
a
n
a
l
y
s
i
s
c
o
m
p
o
n
e
n
t
s
(
c
o
n
t
.
)
Within the context of the global and economic crisis a detailed PESTEL analysis and SWOT analysis was conducted to
understand the internal and external environment and the impact of key developments on SITA business.
Various consultations with key internal and external stakeholders, through focus groups, strategy planning sessions,
stakeholder surveys and interviews enabled the gathering of information on customers needs, priorities, expectations,
customer challenges, internal organisational challenges that compromise service delivery and improvement areas.
The outputs of the abovementioned analysis together with identified Shareholder priority areas became an input to set
strategic priorities, focus energy and resources and collaborate cross functionally within the organisation to develop an
APP that will enable SITA to mitigate against findings of the Auditor-General and optimally deliver on its mandate to
achieve intended outcomes and results.
SITA will create customer value through the delivery of key focus areas, namely; procurement and transformation, people
and talent management, infrastructure and technology, digital services, digital and ethical culture, research and
innovation and financial sustainability.
During the upcoming medium-term period, SITA will continue to implement planned activities to enable the
government’s digital transformation agenda as informed by its mandate, revised MTSF focus areas, shareholder
outcomes and PC4IR targets.
Overall the SITA APP is destined to bring about transformation supported by enablers which will promote integration,
improvement, and innovation thereby creating value for the benefit of SITA, the Shareholder and the citizen.
F
I
V
E
S
T
R
A
T
E
G
I
C
P
R
O
G
R
A
M
M
E
S
P
r
o
g
r
a
m
m
e
1
:
T
h
o
u
g
h
t
L
e
a
d
e
r
s
h
i
p
a
n
d
S
e
r
v
i
c
e
D
e
l
i
v
e
r
y
Output 1: Core public facing services
Output 2: Applications Programming Interfaces (APIs)
Output 3: Artificial Intelligence /IoT Use Cases
Output 4: Modernisation of legacy systems
Output 5:
Open innovation solutions commercialised
Output 6:
Customer Satisfaction
9
P
r
o
g
r
a
m
m
e
1
:
T
h
o
u
g
h
t
L
e
a
d
e
r
s
h
i
p
a
n
d
S
e
r
v
i
c
e
D
e
l
i
v
e
r
y
Output 1: Core public facing services available on digital platforms
10
P
r
o
g
r
a
m
m
e
1
:
T
h
o
u
g
h
t
L
e
a
d
e
r
s
h
i
p
a
n
d
S
e
r
v
i
c
e
D
e
l
i
v
e
r
y
Output 2: Application Programming Interfaces
11
P
r
o
g
r
a
m
m
e
1
:
T
h
o
u
g
h
t
L
e
a
d
e
r
s
h
i
p
a
n
d
S
e
r
v
i
c
e
D
e
l
i
v
e
r
y
Output 3: Artificial Intelligence/IoT Use Cases
12
P
r
o
g
r
a
m
m
e
1
:
T
h
o
u
g
h
t
L
e
a
d
e
r
s
h
i
p
a
n
d
S
e
r
v
i
c
e
D
e
l
i
v
e
r
y
Output 4:
Modernisation of legacy systems
P
r
o
g
r
a
m
m
e
1
:
T
h
o
u
g
h
t
L
e
a
d
e
r
s
h
i
p
a
n
d
S
e
r
v
i
c
e
D
e
l
i
v
e
r
y
Output 5:
Open innovation solutions commercialised
P
r
o
g
r
a
m
m
e
1
:
T
h
o
u
g
h
t
L
e
a
d
e
r
s
h
i
p
a
n
d
S
e
r
v
i
c
e
D
e
l
i
v
e
r
y
Output 6:
Customer Satisfaction
P
r
o
g
r
a
m
m
e
2
:
D
i
g
i
t
a
l
I
n
f
r
a
s
t
r
u
c
t
u
r
e
Output 7:
SA Connect
Output 8: Software-defined network (SDN)
Output 9: Data Centre Modernisation
Output 10: Security Operations Centre Capability
(SOCC)
P
r
o
g
r
a
m
m
e
2
:
D
i
g
i
t
a
l
I
n
f
r
a
s
t
r
u
c
t
u
r
e
Output 7:
SA Connect
P
r
o
g
r
a
m
m
e
2
:
D
i
g
i
t
a
l
I
n
f
r
a
s
t
r
u
c
t
u
r
e
Output 8:
Software-defined Network
P
r
o
g
r
a
m
m
e
2
:
D
i
g
i
t
a
l
I
n
f
r
a
s
t
r
u
c
t
u
r
e
Output 9:
Data Centre Modernisation
P
r
o
g
r
a
m
m
e
2
:
D
i
g
i
t
a
l
I
n
f
r
a
s
t
r
u
c
t
u
r
e
Output 10:
Security Operations Centre Capability (SOCC)
P
r
o
g
r
a
m
m
e
3
:
S
k
i
l
l
s
a
n
d
C
a
p
a
b
i
l
i
t
y
D
e
v
e
l
o
p
m
e
n
t
Output 11: Workplace Skills Plan (WSP)
Output 12: Culture Improvement Plan
P
r
o
g
r
a
m
m
e
3
:
S
k
i
l
l
s
a
n
d
C
a
p
a
c
i
t
y
D
e
v
e
l
o
p
m
e
n
t
Output 11:
Workplace Skills Plan
P
r
o
g
r
a
m
m
e
3
:
S
k
i
l
l
s
a
n
d
C
a
p
a
c
i
t
y
D
e
v
e
l
o
p
m
e
n
t
Output 12:
Culture Improvement Plan
P
r
o
g
r
a
m
m
e
4
:
F
i
n
a
n
c
i
a
l
S
u
s
t
a
i
n
a
b
i
l
i
t
y
Output 13: Improved profitability - EBITDA
Output 14: Improved profitability – Net collection rate
Output 15: Growth in revenue
P
r
o
g
r
a
m
m
e
4
:
F
i
n
a
n
c
i
a
l
S
u
s
t
a
i
n
a
b
i
l
i
t
y
Output 13:
Financial sustainability - EBITDA
P
r
o
g
r
a
m
m
e
4
:
F
i
n
a
n
c
i
a
l
S
u
s
t
a
i
n
a
b
i
l
i
t
y
Output 14:
Net Collection Rate
P
r
o
g
r
a
m
m
e
4
:
F
i
n
a
n
c
i
a
l
S
u
s
t
a
i
n
a
b
i
l
i
t
y
Output 15:
Growth in Revenue
P
r
o
g
r
a
m
m
e
5
P
r
o
c
u
r
e
m
e
n
t
a
n
d
I
n
d
u
s
t
r
y
T
r
a
n
s
f
o
r
m
a
t
i
o
n
Output 16: Procurement turnaround times
Output 17:
Transversal & panel contracts / framework agreements
Output 18:
Acquisition spend through black SMME
P
r
o
g
r
a
m
m
e
5
:
P
r
o
c
u
r
e
m
e
n
t
a
n
d
I
n
d
u
s
t
r
y
T
r
a
n
s
f
o
r
m
a
t
i
o
n
Output 16: Procurement awards completed
P
r
o
g
r
a
m
m
e
5
:
P
r
o
c
u
r
e
m
e
n
t
a
n
d
I
n
d
u
s
t
r
y
T
r
a
n
s
f
o
r
m
a
t
i
o
n
Output 17:
Transversal & panel contracts / framework agreements
P
r
o
g
r
a
m
m
e
5
:
P
r
o
c
u
r
e
m
e
n
t
a
n
d
I
n
d
u
s
t
r
y
T
r
a
n
s
f
o
r
m
a
t
i
o
n
Output 18: Acquisition spend on black SMME
B
u
d
g
e
t
e
d
F
i
n
a
n
c
i
a
l
S
t
a
t
e
m
e
n
t
s
&
K
e
y
R
i
s
k
&
M
i
t
i
g
a
t
i
o
n
P
l
a
n
O
v
e
r
v
i
e
w
o
f
t
h
e
F
Y
2
0
2
2
/
2
3
b
u
d
g
e
t
a
n
d
M
T
E
F
e
s
t
i
m
a
t
e
s
R
e
v
e
n
u
e
Revenue for the FY2022/2023 is estimated at
R5.917billion
This is an increase of 4% as compared to the
forecast of the FY2021/22.
The increase in revenue will be achieved through
business development, harnessing more value and
achieving a larger share of the current approved
ICT spend.
O
p
e
r
a
t
i
o
n
a
l
e
x
p
e
n
d
i
t
u
r
e
Cost of sales increased by 5.1% when compared to the
FY2021/2022 forecast to R4.175bn for the 2022/2023
financial year which is aligned with the concerted cost
cutting measures that have been implemented.
Operating expenses (Opex) are expected to increase
by 25% from a forecast of R1.387bn for the FY2021/22
financial year to an estimated R1.728bn in the
FY2022/23.
C
a
p
i
t
a
l
e
x
p
e
n
d
i
t
u
r
e
The total capital expenditure requirement for the FY2022/23 is
budgeted at R750m. However, the actual total Capex
requirement far exceeds this amount.
SITA may have to consider borrowing funds as well as applying
for conditional grants in order to meet its capital expenditure
requirements.
As per currently available information the allocation of capital
expenditure per programme is reflected below
S
t
a
t
e
m
e
n
t
o
f
F
i
n
a
n
c
i
a
l
P
e
r
f
o
r
m
a
n
c
e
S
t
a
t
e
m
e
n
t
o
f
F
i
n
a
n
c
i
a
l
P
o
s
i
t
i
o
n
S
t
a
t
e
m
e
n
t
o
f
F
i
n
a
n
c
i
a
l
P
o
s
i
t
i
o
n
B
u
d
g
e
t
p
e
r
P
r
o
g
r
a
m
m
e
U
p
d
a
t
e
d
K
e
y
R
i
s
k
s
U
p
d
a
t
e
d
K
e
y
R
i
s
k
s
U
p
d
a
t
e
d
K
e
y
R
i
s
k
s
T
H
A
N
K
Y
O
U
SITA's annual performance plan and strategy for FY2022-2023 focus on delivering efficient ICT services to the public sector, enhancing digital infrastructure, and promoting economic transformation. Alignments to MTSF and DCDT outcomes are crucial for seamless implementation of government priorities. With a vision of becoming a leading ICT agency in public service delivery, SITA aims to drive innovation, integrity, and collaboration while enhancing citizen value and cybersecurity measures. Key areas include e-services deployment, economic transformation, and job creation initiatives.

Download Presentation

Please find below an Image/Link to download the presentation.
The content on the website is provided AS IS for your information and personal use only. It may not be sold, licensed, or shared on other websites without obtaining consent from the author. Download presentation by click this link. If you encounter any issues during the download, it is possible that the publisher has removed the file from their server.
E N D
Presentation Transcript
SITA Annual Performance Plan SITA Annual Performance Plan FY2022 FY2022- -2023 2023 Presented by: Managing Director (Interim) Mr Luvuyo Keyise
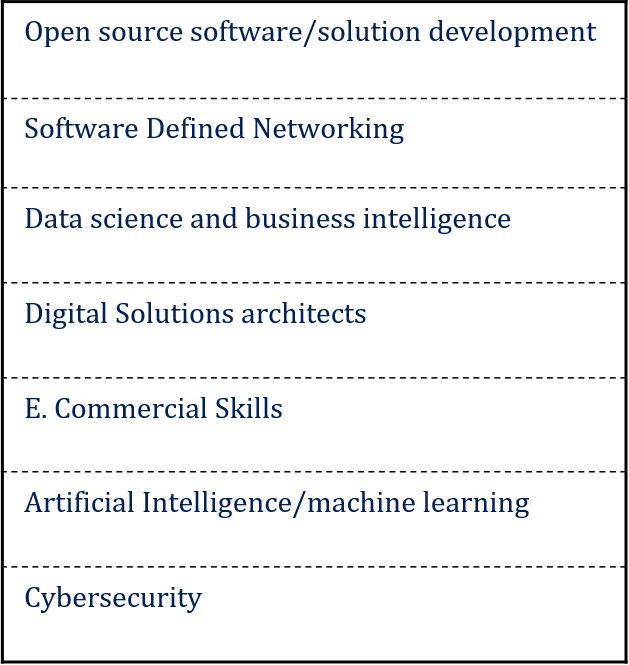
SITA STRATEGY 2020/21 2024/25 Values Mission Statement Vision Statement Customer centricity Innovation Integrity Agility Collaboration Empathy To render an efficient and value-added ICT service to the public sector in a secure, cost effective and integrated manner, contributing to service delivery and citizen convenience. To be the leading information and communications technology (ICT) agency in public service delivery. Initial State of the Organization Digital Capabilities Target State of the Organization 3-year target Outcomes Open source software/solution development 1. Seamless integrated and trusted public services 1. 60% customer satisfaction level 1. 51% customer satisfaction level Software Defined Networking 2. 0% core public facing services on digital platforms 2. 40% core public facing services available on digital platforms 2. Increased citizen value through availability & accessibility of core government public facing services on digital platforms Data science and business intelligence 3. Level 1 digital infrastructure as per the digital government maturity model. 3. Attain maturity level 2 digital infrastructure as per the digital government maturity model 3. Optimised digital infrastructure Digital Solutions architects 4. Enhanced workforce capability solving complex problems and adopting innovative solutions 4. (No baseline) 4. 50% digitally capable workforce E. Commercial Skills 5. -1% profitability 5. 3% increase in profitability 5. Innovative digital service investments promoting financial sustainability Artificial Intelligence/machine learning 6. 10 % of black SMME's suppliers in SITA 6. 50% of black SMME's suppliers in SITA 6. Reshaping the supply chain through ICT economic transformation. Cybersecurity Provincial and Local Government Digitalization Research Innovation and localization Cyber & Information Security Achieve: Digital Transformation for internal SITA environment and Client environment Modernization of legacy systems: Electronic Government Strategic initiatives and Projects: Reformed Procurement Cloud Computing 2
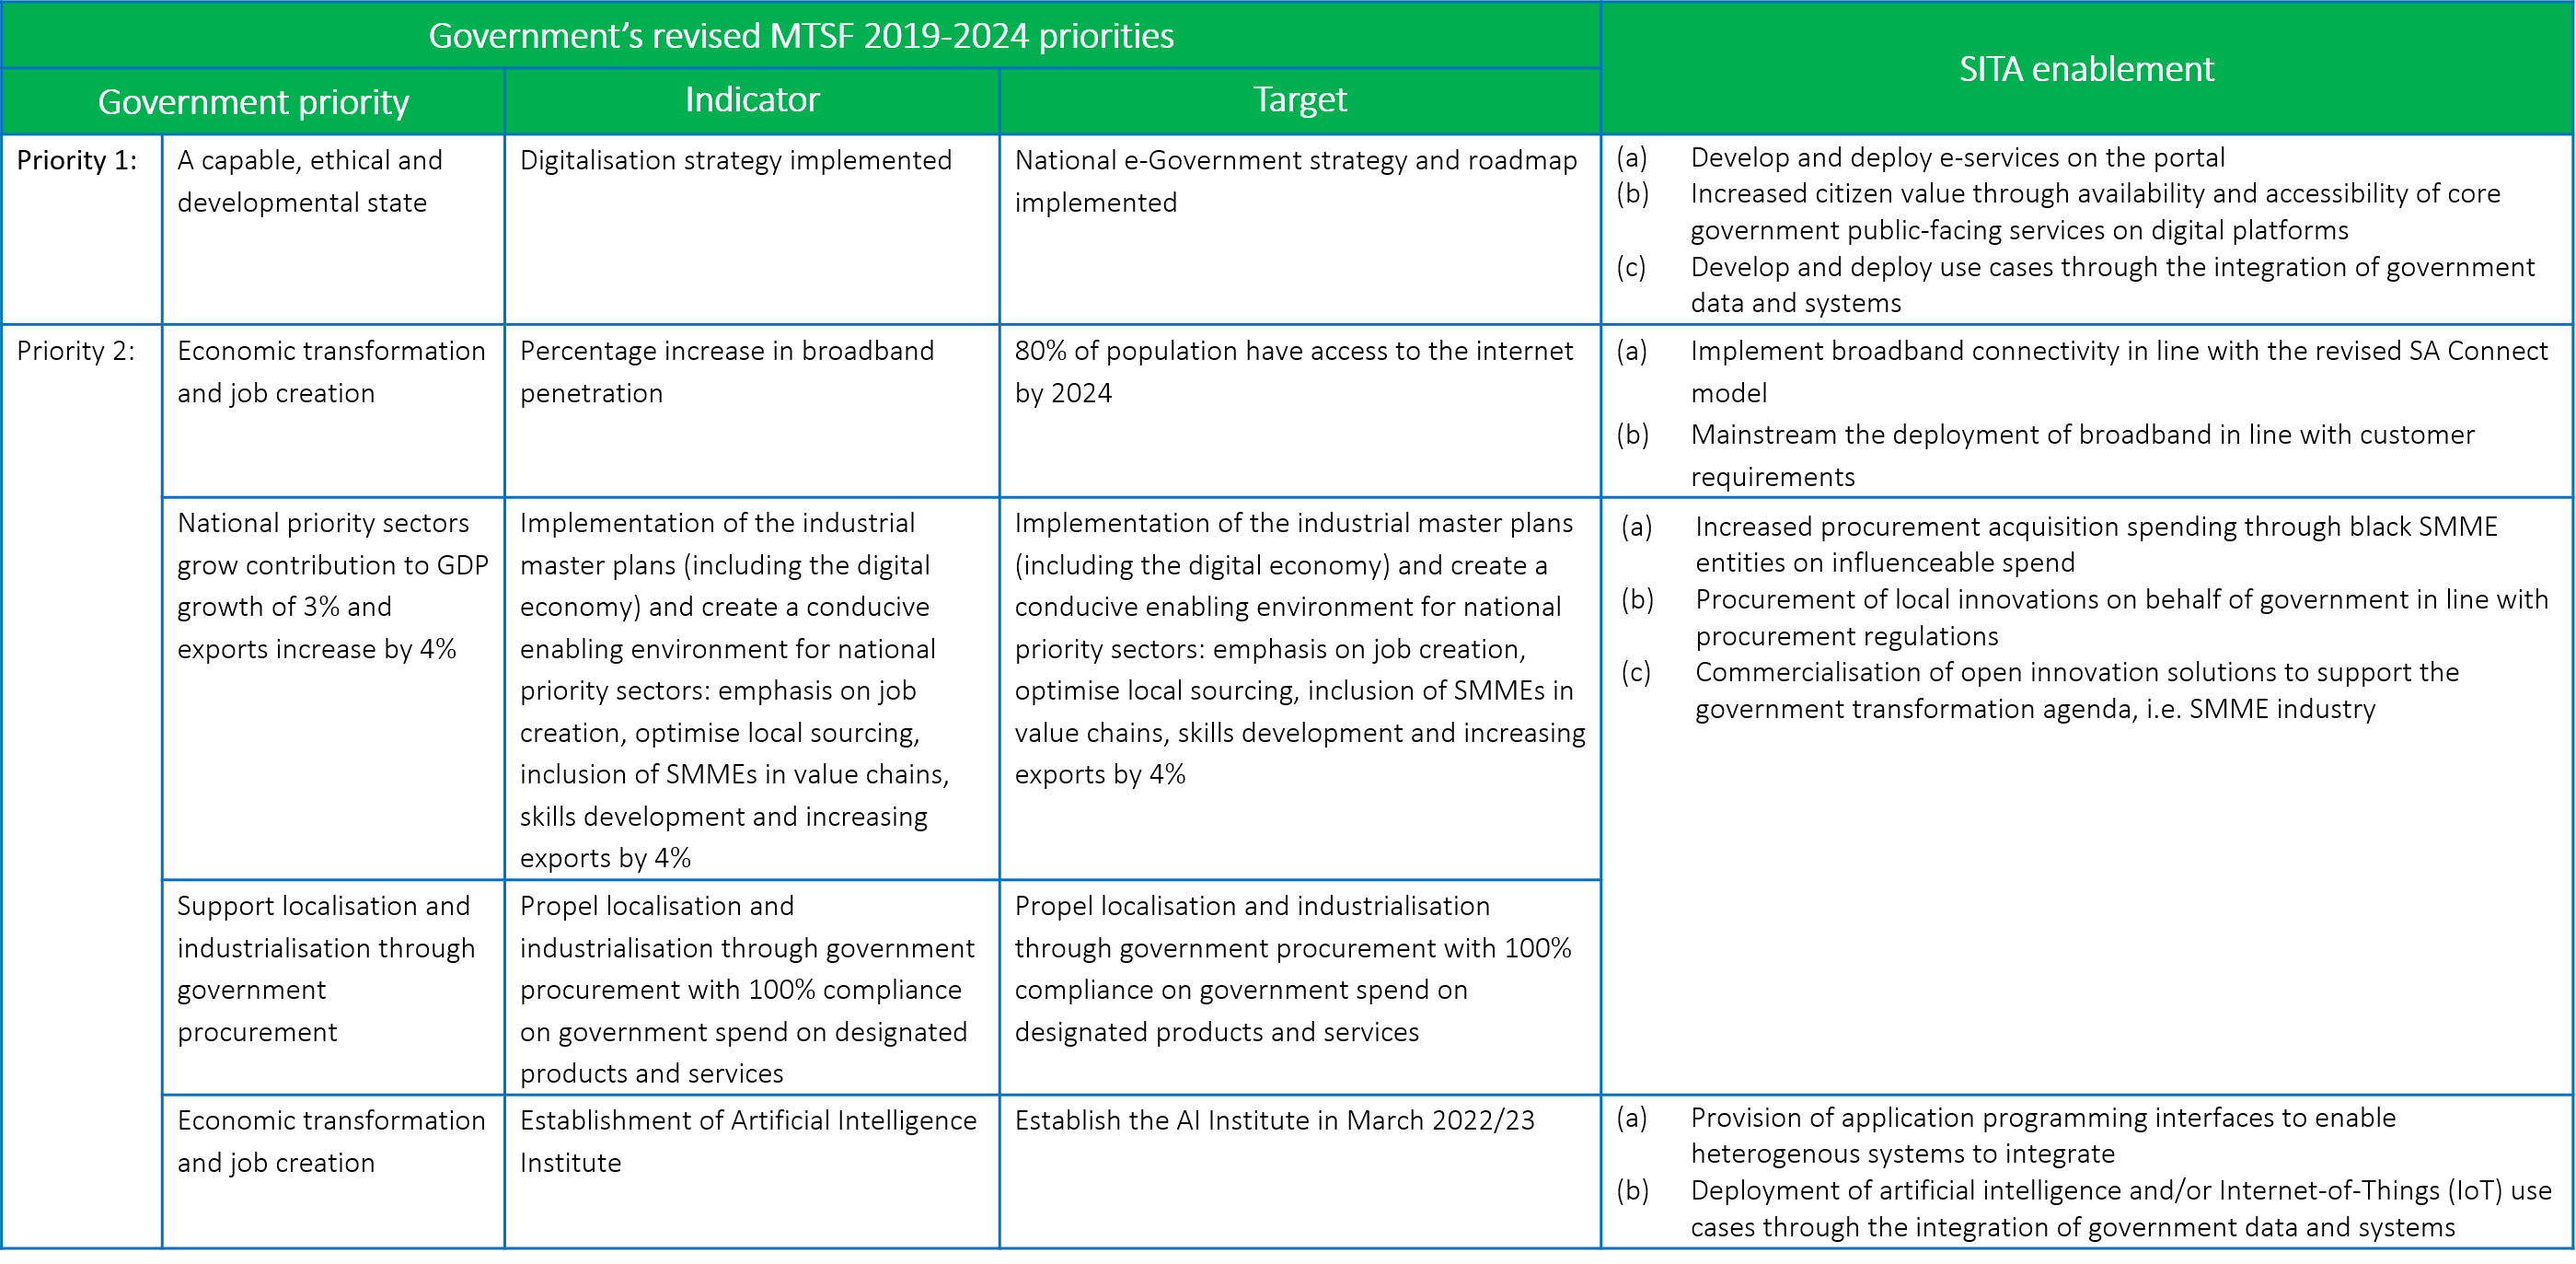
Alignment to MTSF and DCDT outcomes Alignment to MTSF and DCDT outcomes SITA in consultation with DCDT alignment its APP targets with DCDT outcomes to ensure seamless implementation of government priorities. Government s revised MTSF 2019 Government s revised MTSF 2019- -2024 priorities 2024 priorities SITA enablement SITA enablement Indicator Indicator Target Target Government priority Government priority (a) (b) Develop and deploy e-services on the portal Increased citizen value through availability and accessibility of core government public-facing services on digital platforms Develop and deploy use cases through the integration of government data and systems Priority 1: A capable, ethical and developmental state Digitalisation strategy implemented National e-Government strategy and roadmap implemented (c) Priority 2: Economic transformation and job creation Percentage increase in broadband penetration 80% of population have access to the internet by 2024 (a) Implement broadband connectivity in line with the revised SA Connect model Mainstream the deployment of broadband in line with customer requirements (b) National priority sectors grow contribution to GDP growth of 3% and exports increase by 4% Implementation of the industrial master plans (including the digital economy) and create a conducive enabling environment for national priority sectors: emphasis on job creation, optimise local sourcing, inclusion of SMMEs in value chains, skills development and increasing exports by 4% Implementation of the industrial master plans (including the digital economy) and create a conducive enabling environment for national priority sectors: emphasis on job creation, optimise local sourcing, inclusion of SMMEs in value chains, skills development and increasing exports by 4% (a) Increased procurement acquisition spending through black SMME entities on influenceable spend Procurement of local innovations on behalf of government in line with procurement regulations Commercialisation of open innovation solutions to support the government transformation agenda, i.e. SMME industry (b) (c) Support localisation and industrialisation through government procurement Propel localisation and industrialisation through government procurement with 100% compliance on government spend on designated products and services Propel localisation and industrialisation through government procurement with 100% compliance on government spend on designated products and services (a) Provision of application programming interfaces to enable heterogenous systems to integrate Deployment of artificial intelligence and/or Internet-of-Things (IoT) use cases through the integration of government data and systems Economic transformation and job creation Establishment of Artificial Intelligence Institute Establish the AI Institute in March 2022/23 (b) 3 SITA SOC Ltd
Alignment to MTSF and DCDT outcomes (cont.) Alignment to MTSF and DCDT outcomes (cont.) SITA in consultation with DCDT alignment its APP targets with DCDT outcomes to ensure seamless implementation of government priorities. Government s revised MTSF 2019 Government s revised MTSF 2019- -2024 priorities 2024 priorities SITA enablement SITA enablement Indicator Indicator Target Target Government priority Government priority Priority 3: Education, skills and health Number of schools connected for teaching and learning DBE to collaborate with DCDT to ensure 90% school connectivity (a) connectivity to schools (b) Mainstream the deployment of broadband in line with customer requirements Provision and maintenance of broadband services to support Priority 6: Social cohesion and safe communities Architecture/design of the Integrated Cybersecurity Centre completed and approved Operationalise the approved operating model for the Integrated Cybersecurity Centre (a) (b) (c) Establishment of the Security Operations Centre capability (SOCC) Provision of Security Operations Centre services to customers Implementation of planned milestones for SOCC on all SITA VPNs 4 SITA SOC Ltd
Summary Summary of key situational analysis components of key situational analysis components The COVID-19 pandemic which is persisting for nearly two years has profoundly impacted the digital landscape of South Africa (SA) and by default still positively impacts SITA s strategic direction. The overall result is that the general need by citizens to access government services through digital platforms is more prominent than ever before which compels government to embrace the accelerated pace of digital transformation and adopt new technologies. There is therefore an urgency to accelerate the implementation of policies and programmes aimed at bridging the digital divide which is also highlighted as a contributing factor to worsening the socioeconomic status of SA. The ICT sector remains an enabler of growth and job creation; therefore, SITA s role as an organ of state becomes more apparent and very relevant within the context of the Fourth Industrial Revolution. SITA will leverage the existing appetite for digital technologies in partnership with the ICT ecosystem to augment its capability to meet the customers demands while also adopting a pricing model that considers diverse customer needs. In alignment to SITA annual integrated outcome - based planning approach which is guided by the revised DPME planning framework for Strategic Plans (SPs) and Annual Performance Plans (APPs), the strategic planning process was implemented as an organisational activity. 5 SITA SOC Ltd
Summary Summary of key situational analysis components (cont.) of key situational analysis components (cont.) Within the context of the global and economic crisis a detailed PESTEL analysis and SWOT analysis was conducted to understand the internal and external environment and the impact of key developments on SITA business. Various consultations with key internal and external stakeholders, through focus groups, strategy planning sessions, stakeholder surveys and interviews enabled the gathering of information on customers needs, priorities, expectations, customer challenges, internal organisational challenges that compromise service delivery and improvement areas. The outputs of the abovementioned analysis together with identified Shareholder priority areas became an input to set strategic priorities, focus energy and resources and collaborate cross functionally within the organisation to develop an APP that will enable SITA to mitigate against findings of the Auditor-General and optimally deliver on its mandate to achieve intended outcomes and results. SITA will create customer value through the delivery of key focus areas, namely; procurement and transformation, people and talent management, infrastructure and technology, digital services, digital and ethical culture, research and innovation and financial sustainability. During the upcoming medium-term period, SITA will continue to implement planned activities to enable the government s digital transformation agenda as informed by its mandate, revised MTSF focus areas, shareholder outcomes and PC4IR targets. Overall the SITA APP is destined to bring about transformation supported by enablers which will promote integration, improvement, and innovation thereby creating value for the benefit of SITA, the Shareholder and the citizen. 6 SITA SOC Ltd
FIVE STRATEGIC PROGRAMMES FIVE STRATEGIC PROGRAMMES Programme 2: Programme 3: Programme 5: Programme 4: Programme 1: Thought Leadership and Service Delivery Digital Infrastructure Skills and Capacity Development Procurement and Industry Transformation Financial Sustainability To provide well researched, tested, innovative and secure solutions, products and services aimed at digitizing government and improving citizen s experience of government services. To optimise and or build the required computing capability such as platforms, networks, storage etc. to enable the provisioning of digital services and solutions at increased availability, flexibility, scalability, predictability and security. To develop, build and or buy the required digital skills and capability to enable the strategic drive to digitise government while building a culture of performance, accountability, corruption free and consequence management To ensure effective and efficient financial management and commercial awareness in investment decisions to ensure financial growth and sustainability. To advance transformation of the ICT sector to stimulate economic growth, development of local ICT content and transforming the capability towards the reduction of unemployment and poverty alleviation, supporting development and promoting fair, equitable, transparent and cost - effective procurement services. radically procurement skills 7 SITA SOC Ltd
Programme 1: Programme 1: Thought Leadership and Service Thought Leadership and Service Delivery Delivery Output 1: Core public facing services Output 2: Applications Programming Interfaces (APIs) Output 3: Artificial Intelligence /IoT Use Cases Output 4: Modernisation of legacy systems Output 5: Open innovation solutions commercialised Output 6: Customer Satisfaction
Output 1: Core public facing services available on digital platforms Programme 1: Thought Leadership and Service Delivery Programme 1: Thought Leadership and Service Delivery Past Performance Past Performance Medium Term 2022 Medium Term 2022 - - 2025 2025 Outcomes Outcomes Outputs Outputs Output indicators Output indicators Estimated Estimated performance performance 2021 2021- -2022 2022 Baseline of candidate core public facing services for digitisation established 2018 2018- -2019 2019 2019 2019- -2020 2020 2020 2020- -2021 2021 2022 2022- -2023 2023 2023 2023- -2024 2024 2024 2024- -2025 2025 Increased citizen value through availability & accessibility of core government public facing services on digital platforms Core public facing services available on digital platforms % core public facing services available on digital platforms - - - 40% core public facing services available on digital platforms 70% core public facing services available on digital platforms 100% core public facing services available on digital platforms Outcome Outcome Output Output Output Output Indicators Indicators Output Definition Output Definition Baseline Baseline Annual Target Annual Target Quarterly Targets Quarterly Targets Quarter2 Quarter2 Quarter1 Quarter1 Quarter3 Quarter3 Quarter4 Quarter4 2021 2021- -2022 2022 2022 2022- -2023 2023 Baseline of candidate core public facing services for digitisation established 40% core public facing services available on digital platforms Solution Architecture for candidate services approved 15% core public facing services available on digital platforms 30% core public facing services available on digital platforms 40% core public facing services available on digital platforms Increased citizen value through availability & accessibility of core government public facing services on digital platforms Core public facing services available on digital platforms % core public facing services available on digital platforms The automation of key public facing services in order to ensure access and availability of these services to the citizens on digital platforms and thereby improving their experience of government service delivery 9 9 SITA SOC Ltd
Programme 1: Thought Leadership and Service Delivery Programme 1: Thought Leadership and Service Delivery Output 2: Application Programming Interfaces Past Performance Past Performance Medium Term 2022 Medium Term 2022 2025 2025 Outcomes Outcomes Outputs Outputs Output indicators Output indicators Estimated Estimated performance performance 2021 2021- -2022 2022 8 APIs established and published in production 2018 2018- -2019 2019 2019 2019- -2020 2020 2020 2020- -2021 2021 2022 2022- -2023 2023 2023 2023- -2024 2024 2024 2024- -2025 2025 Increased citizen value through availability & accessibility of core government public facing services on digital platforms Application Programming Interfaces (APIs) established and published in production # APIs established to enable heterogenous systems to integrate - - - 20 APIs established and published in production 50 APIs established and published in production 70 APIs established and published in production Outcome Outcome Output Output Output Output Indicators Indicators Output Definition Output Definition Baseline Baseline Annual Target Annual Target Quarterly Targets Quarterly Targets Quarter2 Quarter2 Quarter1 Quarter1 Quarter3 Quarter3 Quarter4 Quarter4 2021 2021- -2022 2022 2022 2022- -2023 2023 20 APIs established and published in production Application Programming Interfaces (APIs) established to enable heterogenous systems to integrate # APIs established and published in production 8 APIs established and published in production API architecture for candidate APIs approved 5 APIs established and published in production 10 APIs established and published in production 20 APIs established and published in production Increased citizen value through availability & accessibility of core government public facing services on digital platforms APIs are capabilities and utilities that enable the ease of integration of heterogeneous systems, enabling interoperability of and ease of exchange of data between these systems 10 10 SITA SOC Ltd
Output 3: Artificial Intelligence/IoT Use Cases Programme 1: Thought Leadership and Service Delivery Programme 1: Thought Leadership and Service Delivery Past Performance Past Performance Medium Term 2022 Medium Term 2022 2025 2025 Outcomes Outcomes Outputs Outputs Output indicators Output indicators Estimated Estimated performance performance 2021 2021- -2022 2022 4 Big Data Analytics Use Cases deployed through the integration of government data and systems 2018 2018- -2019 2019 2019 2019- -2020 2020 2020 2020- -2021 2021 2022 2022- -2023 2023 2023 2023- -2024 2024 2024 2024- -2025 2025 Increased citizen value through availability & accessibility of core government public facing services on digital platforms Artificial Intelligence and/ IoT use cases deployed through the integration of government data and systems # Artificial Intelligence and/ IoT use cases deployed through the integration of government data and systems - - 1 Big Data Analytics Use Case deployed through the integration of government data and systems 4 Artificial Intelligence and/ IoT Use Cases deployed through the integration of government data and systems 10 Artificial Intelligence and/ IoT Use Cases deployed through the integration of government data and systems 12 Artificial Intelligence and/ IoT Use Cases deployed through the integration of government data and systems Outcome Outcome Output Output Output Output Indicators Indicators Output Definition Output Definition Baseline Baseline Annual Target Annual Target Quarterly Targets Quarterly Targets Quarter2 Quarter2 Quarter1 Quarter1 Quarter3 Quarter3 Quarter4 Quarter4 2021 2021- -2022 2022 2022 2022- -2023 2023 4 Artificial Intelligence and/ IoT Use Cases deployed through the integration of government data and systems Solution Architecture for 2 Artificial Intelligence and/ IoT Use Cases approved 2 Artificial Intelligence and/ IoT Use Cases deployed in production Solution Architecture for 2 Artificial Intelligence and/ IoT Use Cases approved 4 Artificial Intelligence and/ IoT Use Cases deployed through the integration of government data and systems Increased citizen value through availability & accessibility of core government public facing services on digital platforms Artificial Intelligence and/ IoT use cases deployed through the integration of government data and systems # Artificial Intelligence and/ IoT use cases deployed through the integration of government data and systems Use case to showcase the outcome/results of analytics derived from big data stored in the underlying data-sharing platform 4 Big Data Analytics Use Cases deployed through the integration of government data and systems 11 11 SITA SOC Ltd
Output 4: Modernisation of legacy systems Programme 1: Thought Leadership and Service Delivery Programme 1: Thought Leadership and Service Delivery Past Performance Past Performance Medium Term 2022 Medium Term 2022 2025 2025 Outcomes Outcomes Outputs Outputs Output indicators Output indicators Estimated Estimated performance performance 2021 2021- -2022 2022 100 % milestones implemented for the legacy systems modernisation plan as per allocated funding 2018 2018- -2019 2019 2019 2019- -2020 2020 2020 2020- -2021 2021 2022 2022- -2023 2023 2023 2023- -2024 2024 2024 2024- -2025 2025 Increased citizen value through availability & accessibility of core government public facing services on digital platforms Modernisation of legacy systems % Modernisation implemented as per allocated funding Legacy Systems plan - - - 100 % milestones implemented for the legacy systems modernisation plan as per allocated funding 100 % milestones implemented for the legacy systems modernisation plan as per allocated funding 100% milestones implemented for the legacy systems modernisation plan as per allocated funding Outcome Outcome Output Output Output Output Indicators Indicators Output Definition Output Definition Baseline Baseline Annual Target Annual Target Quarterly Targets Quarterly Targets Quarter2 Quarter2 Quarter1 Quarter1 Quarter3 Quarter3 Quarter4 Quarter4 2021 2021- -2022 2022 2022 2022- -2023 2023 100 % milestones implemented for the legacy systems modernisation plan as per allocated funding 25 % milestones implemented for the legacy systems modernisation plan as per allocated funding 50% milestones implemented for the legacy systems modernisation plan as per allocated funding 75% milestones implemented for the legacy systems modernisation plan as per allocated funding 100 % milestones implemented for the legacy systems modernisation plan as per allocated funding Increased citizen value through availability & accessibility of core government public facing services on digital platforms Modernisation of legacy systems % Legacy Systems Modernisation plan implemented as per allocated funding To ensure the availability of modern, cost effective and fit- for-purpose, technology to serve the information technology and information requirements of government - 12 12 SITA SOC Ltd
Programme 1: Thought Leadership and Service Delivery Programme 1: Thought Leadership and Service Delivery Output 5: Open innovation solutions commercialised Past Performance Past Performance Medium Term 2022 Medium Term 2022 2025 2025 Outcomes Outcomes Outputs Outputs Output indicators Output indicators Estimated Estimated performance performance 2021 2021- -2022 2022 2 Open innovation solutions commercialised 2018 2018- -2019 2019 2019 2019- -2020 2020 2020 2020- -2021 2021 2022 2022- -2023 2023 2023 2023- -2024 2024 2024 2024- -2025 2025 Seamless integrated and trusted public services Open innovation solutions commercialised # Open innovation solutions commercialised - - 2 Open innovation solution commercialised 3 Open innovation solutions commercialised 4 Open innovation solutions commercialised 5 Open innovation solutions commercialised Outcome Outcome Output Output Output Output Indicators Indicators Output Definition Output Definition Baseline Baseline Annual Target Annual Target Quarterly Targets Quarterly Targets Quarter2 Quarter2 Quarter1 Quarter1 Quarter3 Quarter3 Quarter4 Quarter4 2021 2021- -2022 2022 2022 2022- -2023 2023 Open innovation solutions commercialised To grow SMMEs through innovation and to drive the government transformation agenda by enabling and unlocking opportunities for procurement and innovation while building local ICT capability to enable SMMEs to develop their current solutions for government consumption. 2 Open innovation solution commercialised Seamless integrated and trusted public services # Open Innovation solutions commercialised 3 Open Innovation solution commercialised Open innovation solution commercialisation implementation plan developed 1 Open Innovation solution commercialised 2 Open Innovation solutions commercialised 3 Open Innovation solutions commercialised 13 SITA SOC Ltd
Programme 1: Thought Leadership and Service Delivery Programme 1: Thought Leadership and Service Delivery Output 6: Customer Satisfaction Past Performance Past Performance Medium Term 2022 Medium Term 2022 2025 2025 Outcomes Outcomes Outputs Outputs Output indicators Output indicators Estimated Estimated performance performance 2021 2021- -2022 2022 - 2018 2018- -2019 2019 2019 2019- -2020 2020 2020 2020- -2021 2021 2022 2022- -2023 2023 2023 2023- -2024 2024 2024 2024- -2025 2025 % customer satisfaction level Seamless integrated and trusted public services Customer satisfaction level improvement - - - Attain 60% customer satisfaction level Attain 70 % customer satisfaction level Attain 80% customer satisfaction level Outcome Outcome Output Output Output Output Indicators Indicators Output Definition Output Definition Baseline Baseline Annual Target Annual Target Quarterly Targets Quarterly Targets Quarter2 Quarter2 Quarter1 Quarter1 Quarter3 Quarter3 Quarter4 Quarter4 2021 2021- -2022 2022 2022 2022- -2023 2023 % customer satisfaction level Customer satisfaction level improvement To measure improvement in customer satisfaction level as per identified customers i.e. consumers of Networks, Hosting, EUC and SCM services thereby assessing the impact of customer service improvement plan 51% customer satisfaction level (FY2017/18) Attain 60 % customer satisfaction level 20% Implementation of the service improvement plan aligned to baseline survey 50% Implementation of the service improvement plan aligned to baseline survey 100% implementati on of the service Improvement Plan aligned to baseline survey Attain 60% customer satisfaction level Seamless integrated and trusted public services 14 SITA SOC Ltd
Programme 2: Programme 2: Digital Infrastructure Digital Infrastructure Output 7: SA Connect Output 8: Software-defined network (SDN) Output 9: Data Centre Modernisation Output 10: Security Operations Centre Capability (SOCC)
Programme 2: Digital Infrastructure Programme 2: Digital Infrastructure Output 7: SA Connect Past Performance Past Performance Medium Term 2022 Medium Term 2022 2025 2025 Outcomes Outcomes Outputs Outputs Output indicators Output indicators Estimated Estimated performance performance 2021 2021- -2022 2022 100% of SA Connect sites connected as per the government order (layer 3 connectivity) 2018 2018- -2019 2019 2019 2019- -2020 2020 2020 2020- -2021 2021 2022 2022- -2023 2023 2023 2023- -2024 2024 2024 2024- -2025 2025 Broadband services to connected sites % Provision of broadband services to connected sites sustained 270 SA Connect sites connected as per the government order 126.9% of SA Connect sites connected at bandwidths of 10 Mbps as per the government order 100% SA Connect sites connected at bandwidths of 10 Mbps as per government order (layer-3 connectivity 100% provision of broadband services to connected sites sustained 100% provision of broadband services to connected sites sustained 100% provision of broadband services to connected sites sustained Optimised digital infrastructure Outcome Outcome Output Output Output Output Indicators Indicators Output Definition Output Definition Baseline Baseline Annual Target Annual Target Quarterly Targets Quarterly Targets Quarter2 Quarter2 Quarter1 Quarter1 Quarter3 Quarter3 Quarter4 Quarter4 2021 2021- -2022 100% of SA connect sites connected as per the government order (layer 3 connectivity) 2022 2022 2022- -2023 2023 100% provision of broadband services to connected sites sustained 100% provision of broadband services to connected sites sustained 100% provision of broadband services to connected sites sustained 100% provision of broadband services to connected sites sustained 100% provision of broadband services to connected sites sustained Optimised Digital infrastructure Broadband services to connected sites % provision of broadband services to connected sites sustained Provision and sustenance of broadband services to connected sites to ensure increased access to secure digital infrastructure and services. 16 SITA SOC Ltd
Programme 2: Digital Infrastructure Programme 2: Digital Infrastructure Output 8: Software-defined Network Past Performance Past Performance Medium Term 2022 Medium Term 2022 2025 2025 Outcomes Outcomes Outputs Outputs Output indicators Output indicators Estimated Estimated performance performance 2021 2021- -2022 2022 75% implementation of planned remediation to address core network single point of failure 2018 2018- -2019 2019 2019 2019- -2020 2020 2020 2020- -2021 2021 2022 2022- -2023 2023 2023 2023- -2024 2024 2024 2024- -2025 2025 Establishment and operationalisation of the software-defined network (SDN) capability % implementation of planned remediation to address core network single point of failure on SITA core equipment - - Not achieved 69.20% Implementation of the planned activities for the Software Define Network (SDN) capability 100% implementation of planned remediation to address core network single point of failure on SITA core equipment Software Define Network (SDN) capability rollout to clients Software Define Network (SDN) capability rollout to clients Optimised Digital infrastructure Outcome Outcome Output Output Output Output Indicators Indicators Output Definition Output Definition Baseline Baseline Annual Target Annual Target Quarterly Targets Quarterly Targets Quarter2 Quarter2 Quarter1 Quarter1 Quarter3 Quarter3 Quarter4 Quarter4 2021 2021- -2022 75% implementation of planned remediation to address core network single point of failure 2022 2022 2022- -2023 100% implementation of planned remediation to address core network single point of failure on SITA core equipment 2023 60% implementation of planned remediation to address core network single point of failure 75% implementation of planned remediation to address core network single point of failure 85% implementatio n of planned remediation to address core network single point of failure 100% implementation of planned remediation to address core network single point of failure Optimised Digital infrastructure Establishment and operationalisati on of the software- defined network (SDN) capability % implementation of planned remediation to address core network single point of failure on SITA core equipment A network modernisation programme to transform government network to be more agile and flexible while enabling the network to be intelligently & centrally controlled 17 SITA SOC Ltd
Programme 2: Digital Infrastructure Programme 2: Digital Infrastructure Output 9: Data Centre Modernisation Past Performance Past Performance Medium Term 2022 Medium Term 2022 2025 2025 Outcomes Outcomes Outputs Outputs Output indicators Output indicators Estimated Estimated performance performance 2021 2021- -2022 2022 40% strategic data centre facilities upgrades completed to support hyperscale infrastructure requirements 2018 2018- -2019 2019 2019 2019- -2020 2020 2020 2020- -2021 2021 2022 2022- -2023 2023 2023 2023- -2024 2024 2024 2024- -2025 2025 Modernise data centre facilities % completion of Phase 2 Data Centre Modernisation Plan to support hyperscale infrastructure requirements - - Complete the following upgrades in line with tier 3 requirements: (a) Uninterruptible power supply (UPS) (b) Fire suppression (c) Access control systems 100% completion of Phase 2 Data Centre Modernisation Plan to support hyperscale infrastructure requirements 100% completion of Phase 3 Data Centre Modernisation Plan to support hyperscale infrastructure requirements Tier III certification Optimised Digital infrastructure Outcome Outcome Output Output Output Output Indicators Indicators Output Definition Output Definition Baseline Baseline Annual Target Annual Target Quarterly Targets Quarterly Targets Quarter2 Quarter2 Quarter1 Quarter1 Quarter3 Quarter3 Quarter4 Quarter4 2021 2021- -2022 40% strategic data centre facilities upgrades completed to support hyperscale infrastructure requirements 2022 2022 2022- -2023 100% completion of Phase 2 Data Centre Modernisation Plan to support hyperscale infrastructure requirements 2023 20% completion of Phase 2 Data Centre Modernisation Plan to support hyperscale infrastructure requirements 40% completion of Phase 2 Data Centre Modernisation Plan to support hyperscale infrastructure requirements 80% completion of Phase 2 Data Centre Modernisation Plan to support hyperscale infrastructure requirements 100% completion of Phase 2 Data Centre Modernisation Plan to support hyperscale infrastructure requirements Optimised Digital infrastructure Modernise Data Centre Facilities % completion of Phase 2 Data Centre Modernisation Plan to support hyperscale infrastructure requirements The modernisation of the data centre in line with industry standards to ensure provisioning of the disaster recovery capability to clients. 18 SITA SOC Ltd
Programme 2: Digital Infrastructure Programme 2: Digital Infrastructure Output 10: Security Operations Centre Capability (SOCC) Past Performance Past Performance Medium Term 2022 Medium Term 2022 - - 2025 2025 Outcomes Outcomes Outputs Outputs Output indicators Output indicators Estimated Estimated performance performance 2021 2021- -2022 2022 100% Implementation of Security Operations Centre Capability on SITA Virtual Private Networks (VPN) 2018 2018- -2019 2019 2019 2019- -2020 2020 2020 2020- -2021 2021 2022 2022- -2023 2023 2023 2023- -2024 2024 2024 2024- -2025 2025 Security Operations Centre Capability (SOCC) established and operationalised for SITA Virtual Private Networks (VPNs) % Implementation of SOCC on all SITA (VPNs) - - - 100% Implementation of SOCC on all SITA VPNs 100% Implementation of SOCC on targeted customers 100% Implementation of SOCC on targeted customers Optimised Digital infrastructure Outcome Outcome Output Output Output Output Indicators Indicators Output Definition Output Definition Baseline Baseline Annual Target Annual Target Quarterly Targets Quarterly Targets Quarter2 Quarter2 Quarter1 Quarter1 Quarter3 Quarter3 Quarter4 Quarter4 2021 2021- -2022 100% Implementation of Security Operations Centre Capability on SITA Virtual Private Networks (VPN) 2022 2022 2022- -2023 100% Implementation of SOCC on all SITA VPNs 2023 Optimised Digital infrastructure 25% Implementation of SOCC on all SITA VPNs 50% Implementation of SOCC on all SITA VPNs 75% Implementati on of SOCC on all SITA VPNs 100% Implementation of SOCC on all SITA VPNs Security Operations Centre Capability (SOCC) established and operationalised for SITA Virtual Private Networks(VPNs) % Implement- ation of SOCC on all SITA (VPNs) A security modernisation programme for the South African Government which will establish a centralized unit that deals with security issues at a technical level. 19 SITA SOC Ltd
Programme 3: Programme 3: Skills and Capability Development Skills and Capability Development Output 11: Workplace Skills Plan (WSP) Output 12: Culture Improvement Plan
Programme 3: Skills and Capacity Development Programme 3: Skills and Capacity Development Output 11: Workplace Skills Plan Past Performance Past Performance Medium Term 2022 Medium Term 2022 - - 2025 2025 Outcomes Outcomes Outputs Outputs Output indicators Output indicators Estimated Estimated performance performance 2021 2021- -2022 2022 2018 2018- -2019 2019 2019 2019- -2020 2020 2020 2020- -2021 2021 2022 2022- -2023 2023 2023 2023- -2024 2024 2024 2024- -2025 2025 Enhanced workforce Employees trained against the workplace skills plan (WSP) % employees trained against the WSP - 79.5% of employees trained against the WSP 81% of employees trained against the WSP 70% of employees trained against the WSP 75% of employees trained against the WSP 80% of employees trained against the WSP 85% of employees trained against the WSP capability solving complex problems and adopting innovative solutions Outcome Outcome Output Output Output Output Indicators Indicators Output Definition Output Definition Baseline Baseline Annual Target Annual Target Quarterly Targets Quarterly Targets Quarter2 Quarter2 Quarter1 Quarter1 Quarter3 Quarter3 Quarter4 Quarter4 2021 2021- -2022 2022 2022 2022- -2023 2023 Enhanced workforce % employees trained against the WSP 70% of employees trained against the WSP 75% of employees trained against the WSP Annual WSP approved by EXCO 20% of employees trained against the WSP 40% of employees trained against the WSP 75% of employees trained against the WSP Employees trained against the workplace skills plan The ability for an organisation to identify and develop the required skills to capability solving complex problems and adopting innovative solutions meet the current and future business needs (WSP) 21 SITA SOC Ltd
Programme 3: Skills and Capacity Development Programme 3: Skills and Capacity Development Output 12: Culture Improvement Plan Past Performance Past Performance Medium Term 2022 Medium Term 2022 2025 2025 Outcomes Outcomes Output Output Output indicators Output indicators Estimated Estimated performance performance 2021 2021- -2022 2022 2018 2018- -2019 2019 2019 2019- -2020 2020 2020 2020- -2021 2021 2022 2022- -2023 2023 2023 2023- -2024 2024 2024 2024- -2025 2025 Enhanced workforce capability solving complex problems and adopting innovative solutions 100% implementation of culture plan % implementation of milestones as per culture plan - - 54.34% implementation of planned activities as per the culture plan 100% of milestones achieved as per the culture plan 100% implementation of milestones as per culture plan Conduct culture survey (improvement on baseline) Conduct culture survey (improvement on 23/24 survey) Outcome Outcome Output Output Output Output Indicators Indicators Output Definition Output Definition Baseline Baseline Annual Target Annual Target Quarterly Targets Quarterly Targets Quarter2 Quarter2 Quarter1 Quarter1 Quarter3 Quarter3 Quarter4 Quarter4 2021 2021- -2022 100% of milestones achieved as per the culture plan 2022 2022 2022- -2023 100% of milestones achieved as per the culture plan 2023 % implementation of milestones as per culture plan 25% implementation of milestones as per culture plan 50% implementation of milestones as per culture plan 75% implementati on of milestones as per culture plan 100% implementation of milestones as per culture plan Enhanced workforce capability solving complex problems and adopting innovative solutions 100% implementati on of culture plan To embed a culture that consists of shared beliefs and values and then communicated and reinforced through various methods to shape, transform employee perceptions, behaviors and understanding. 22 SITA SOC Ltd
Programme 4: Programme 4: Financial Sustainability Financial Sustainability Output 13: Improved profitability - EBITDA Output 14: Improved profitability Net collection rate Output 15: Growth in revenue
Programme 4: Financial Sustainability Programme 4: Financial Sustainability Output 13: Financial sustainability - EBITDA Past Performance Past Performance Medium Term 2022 Medium Term 2022 2025 2025 Outcomes Outcomes Outputs Outputs Output indicators Output indicators Estimated Estimated performance performance 2021 2021- -2022 2022 2018 2018- -2019 2019 2019 2019- -2020 2020 2020 2020- -2021 2021 2022 2022- -2023 2023 2023 2023- -2024 2024 2024 2024- -2025 2025 Innovative digital service investments promoting financial sustainability #EBITDA R48.3m (EBIT) R245.7m (EBIT) R454.8m R42.2m R328m R378m R428m Improved profitability Outcome Outcome Output Output Output Output Indicators Indicators Output Definition Output Definition Baseline Baseline Annual Target Annual Target Quarterly Targets Quarterly Targets Quarter2 Quarter2 Quarter1 Quarter1 Quarter3 Quarter3 Quarter4 Quarter4 2021 2021- -2022 R42.2m 2022 2022 2022- -2023 R328m 2023 R32.8m R98.4m R196.8m R328m Innovative digital service investments promoting financial sustainability Improved profitability #EBITDA EBITDA is defined as revenue minus expenses, excluding tax, depreciation, amortisation and interest. It is an indicator of a company's profitability 24 SITA SOC Ltd
Programme 4: Financial Sustainability Programme 4: Financial Sustainability Output 14: Net Collection Rate Past Performance Past Performance Medium Term 2022 Medium Term 2022 2025 2025 Outcomes Outcomes Outputs Outputs Output indicators Output indicators Estimated Estimated performance performance 2021 2021- -2022 2022 2018 2018- -2019 2019 2019 2019- -2020 2020 2020 2020- -2021 2021 2022 2022- -2023 2023 2023 2023- -2024 2024 2024 2024- -2025 2025 Innovative digital service Investments promoting financial sustainability % net collection rate 80% net collection rate 87% net collection rate 85.40% net collection rate 80% net collection rate 80% net collection rate 80% net collection rate 85% net collection rate Improved profitability Outcome Outcome Output Output Output Output Indicators Indicators Output Definition Output Definition Baseline Baseline Annual Target Annual Target Quarterly Targets Quarterly Targets Quarter2 Quarter2 Quarter1 Quarter1 Quarter3 Quarter3 Quarter4 Quarter4 2021 2021- -2022 80% net collection rate 2022 2022 2022- -2023 80% net collection rate 2023 - 60% net collection rate 70% net collection rate 80% net collection rate Innovative digital service Investments promoting financial sustainability Improved profitability % net collection rate This measures current year invoices due and receivable and the percentage that SITA actually collects 25 SITA SOC Ltd
Programme 4: Financial Sustainability Programme 4: Financial Sustainability Output 15: Growth in Revenue Past Performance Past Performance Medium Term 2022 Medium Term 2022 - - 2025 2025 Outcomes Outcomes Outputs Outputs Output indicators Output indicators Estimated Estimated performance performance 2021 2021- -2022 2022 2018 2018- -2019 2019 2019 2019- -2020 2020 2020 2020- -2021 2021 2022 2022- -2023 2023 2023 2023- -2024 2024 2024 2024- -2025 2025 Innovative digital service Investments promoting financial sustainability Achieve growth in revenue % Growth in revenue - - -6.2% increase in government market share on designated services (redefined baseline based on SITA s 2019/2020 service portfolio in scope) 10% Growth in revenue related to designated services (defined baseline based on SITA s 2020/21 service portfolio in scope) 10% Growth in revenue related to designated services (defined baseline based on SITA s 2022/23 service portfolio in scope) 10% Growth in revenue related to designated services (defined baseline based on SITA s 2023/24 service portfolio in scope) 10% Growth in revenue related to designated services (defined baseline based on SITA s 2024/25 service portfolio in scope) Outcome Outcome Output Output Output Output Indicators Indicators Output Definition Output Definition Baseline Baseline Annual Target Annual Target Quarterly Targets Quarterly Targets Quarter2 Quarter2 Quarter1 Quarter1 Quarter3 Quarter3 Quarter4 Quarter4 2021 2021- -2022 10% Growth in revenue related to designated services (defined baseline based on SITA s 2020/21 service portfolio in scope) 2022 2022 2022- -2023 10% Growth in revenue related to designated services (defined baseline based on SITA s 2022/23 service portfolio in scope) 2023 - - - 10% Growth in revenue related to designated services (defined baseline based on SITA s 2022/23 service portfolio in scope) Innovative digital service Investments promoting financial sustainability Achieve growth in revenue % Growth in revenue To gauge the extent of growth in revenue relevant to SITA s service portfolio 26 SITA SOC Ltd
Programme 5 Programme 5 Procurement and Industry Transformation Procurement and Industry Transformation Output 16: Procurement turnaround times Output 17: Transversal & panel contracts / framework agreements Output 18: Acquisition spend through black SMME
Programme 5: Procurement and Industry Transformation Programme 5: Procurement and Industry Transformation Output 16: Procurement awards completed Past Performance Past Performance Medium Term 2022 Medium Term 2022 2025 2025 Outcomes Outcomes Outputs Outputs Output indicators Output indicators Estimated Estimated performance performance 2021 2021- -2022 2022 80% of procurement awards completed within targeted turnaround times 2018 2018- -2019 2019 2019 2019- -2020 2020 2020 2020- -2021 2021 2022 2022- -2023 2023 2023 2023- -2024 2024 2024 2024- -2025 2025 Reshaping the supply chain through ICT economic transformation Procurement awards completed within targeted turnaround times % procurement awards completed within targeted turnaround times 33.9% of tender awards completed within the targeted turnaround time 27.04% of tender awards completed within targeted turnaround times 56.50% of procurement awards completed within targeted turnaround times 90% of procurement awards completed within targeted turnaround times 98% of procurement awards completed within targeted turnaround times 98% of procurement awards completed within targeted turnaround times Outcome Outcome Output Output Output Output Indicators Indicators Output Definition Output Definition Baseline Baseline Annual Target Annual Target Quarterly Targets Quarterly Targets Quarter2 Quarter2 Quarter1 Quarter1 Quarter3 Quarter3 Quarter4 Quarter4 2021 2021- -2022 80% of procurement awards completed within targeted turnaround times 2022 2022 2022- -2023 90% of procurement awards completed within targeted turnaround times 2023 Reshaping the supply chain through ICT economic transformation 90% of procurement awards completed within targeted turnaround times 90% of procurement awards completed within targeted turnaround times 90% of procurement awards completed within targeted turnaround times 90% of procurement awards completed within targeted turnaround times Procurement awards made within targeted turnaround times % procurement awards completed within targeted turnaround times A cumulative total number of tenders approved within the targeted turnaround time agreed with the customer 28 SITA SOC Ltd
Programme 5: Procurement and Industry Transformation Programme 5: Procurement and Industry Transformation Output 17: Transversal & panel contracts / framework agreements Past Performance Past Performance Medium Term 2022 Medium Term 2022 2025 2025 Outcomes Outcomes Outputs Outputs Output indicators Output indicators Estimated Estimated performance performance 2021 2021- -2022 2022 2018 2018- -2019 2019 2019 2019- -2020 2020 2020 2020- -2021 2021 2022 2022- -2023 2023 2023 2023- -2024 2024 2024 2024- -2025 2025 Reshaping the supply chain through ICT economic transformation Concluded transversal and panel contracts/ framework agreements # transversal and panel contracts/ framework agreements implemented - - 5 transversal contracts implemented 10 transversal and panel contracts/ framework agreements implemented 15 transversal and panel/ framework agreements implemented 20 transversal and panel contracts/ framework agreements implemented 50 implemented transversal, panel contracts/ framework agreements renewed, refreshed and managed Outcome Outcome Output Output Output Output Indicators Indicators Output Definition Output Definition Baseline Baseline Annual Target Annual Target Quarterly Targets Quarterly Targets Quarter2 Quarter2 Quarter1 Quarter1 Quarter3 Quarter3 Quarter4 Quarter4 2021 2021- -2022 10 transversal and panel contracts/ framework agreements implemented 2022 2022 2022- -2023 15 transversal and panel contracts/ framework agreements implemented 2023 Reshaping the supply chain through ICT economic transformation 2 transversal and panel contracts/ framework agreements implemented 7 transversal and panel contracts/ framework agreements implemented 12 transversal and panel contracts/ framework agreements implemented 15 transversal and panel contracts/ framework agreements implemented Concluded transversal and panel contracts/ framework agreements # transversal and panel contracts/ framework agreements implemented Transversals and panel contracts and framework agreements completed within the financial year aimed at minimising individual procurement requests 29 SITA SOC Ltd
Programme 5: Procurement and Industry Transformation Programme 5: Procurement and Industry Transformation Output 18: Acquisition spend on black SMME Past Performance Past Performance Medium Term 2022 Medium Term 2022 2025 2025 Outcomes Outcomes Outputs Outputs Output indicators Output indicators Estimated Estimated performance performance 2021 2021- -2022 2022 40% of acquisition spend through black SMME entities on influenceable spend 2018 2018- -2019 2019 2019 2019- -2020 2020 2020 2020- -2021 2021 2022 2022- -2023 2023 2023 2023- -2024 2024 2024 2024- -2025 2025 Reshaping the supply chain through ICT economic transformation Increased acquisition spend through black SMME entities on influenceable spend % acquisition spend through black SMME entities on influenceable spend 19.84% of acquisition spend through SMME entities 9.71% of acquisition spend through SMME entities 40.67% of acquisition spend through black SMME entities on influenceable spend 50% of acquisition spend through black SMME entities on influenceable spend 55% of acquisition spend through black SMME entities on influenceable spend 60% of acquisition spend through black SMME entities on influenceable spend Outcome Outcome Output Output Output Output Indicators Indicators Output Definition Output Definition Baseline Baseline Annual Target Annual Target Quarterly Targets Quarterly Targets 2021 2021- -2022 2022 2022 2022- -2023 2023 Quarter1 Quarter1 Quarter2 Quarter2 Quarter3 Quarter3 Quarter4 Quarter4 Reshaping the supply chain through ICT economic transformation 40% of acquisition spend through black SMME entities on influenceable spend 50% of acquisition spend through black SMME entities on influenceable spend Increased acquisition spend through black SMME entities on influenceable spend % acquisition spend through black SMME entities on influenceable spend Acquisition spend through the use of companies classified as black SMMEs (EME & QSE) entities 50% of acquisition spend through black SMME entities on influenceable spend 50% of acquisition spend through black SMME entities on influenceable spend 50% of acquisition spend through black SMME entities on influenceable spend 50% of acquisition spend through black SMME entities on influenceable spend 30 SITA SOC Ltd
Budgeted Financial Statements Budgeted Financial Statements & & Key Risk & Mitigation Plan Key Risk & Mitigation Plan
Overview of the FY2022/23 budget and MTEF estimates Overview of the FY2022/23 budget and MTEF estimates Capital expenditure Capital expenditure The total capital expenditure requirement for the FY2022/23 is budgeted at R750m. However, the actual total Capex requirement far exceeds this amount. Revenue Revenue Revenue for the FY2022/2023 is estimated at R5.917billion This is an increase of 4% as compared to the forecast of the FY2021/22. The increase in revenue will be achieved through business development, harnessing more value and achieving a larger share of the current approved ICT spend. SITA may have to consider borrowing funds as well as applying for conditional grants in order to meet its capital expenditure requirements. As per currently available information the allocation of capital expenditure per programme is reflected below Operational expenditure Operational expenditure Cost of sales increased by 5.1% when compared to the FY2021/2022 forecast to R4.175bn for the 2022/2023 financial year which is aligned with the concerted cost cutting measures that have been implemented. Operating expenses (Opex) are expected to increase by 25% from a forecast of R1.387bn for the FY2021/22 financial year to an estimated R1.728bn in the FY2022/23. Programme Programme Capex allocation Capex allocation Programme 1: Thought leadership and service deliver R 65 730 000 Programme 2: Digital Infrastructure R652 670 000 Programme 3: Skills and capability development R 31 600 000 Programme 4: Financial sustainability - Programme 5: Procurement and industry transformation - Total Total R 750 R 750 000 000 000 000 32 SITA SOC Ltd
Statement of Financial Performance Statement of Financial Performance Audited FY 2018/19 Audited FY 2019/20 Audited FY 2020/21 5 767 771 4 994 558 773 214 3 924 979 682 147 955 799 2 145 609 141 424 1 842 792 Budget 21/22 6 202 407 5 688 304 514 103 4 534 461 Forecast 21/22 5 669 649 5 210 872 458 777 3 971 420 Budget 22/23 5 917 049 5 402 947 514 103 4 174 554 493 538 1 039 841 2 371 114 270 061 1 742 496 Description Total Revenue: Service Revenue Agency Revenue Total Cost of Sales: Agency Cost of Sales Direct Labour Service Delivery Expenses Direct Depreciation Gross Margin - overall Gross Margin % - overall Gross Margin - services Gross Margin % - services Gross Margin - agency Gross Margin % - agency 5 027 324 4 110 910 916 414 4 069 298 967 088 1 356 518 1 593 497 152 196 958 026 5 121 935 4 428 261 693 673 3 704 507 683 253 942 195 1 884 769 194 290 1 417 428 448 836 1 161 595 2 656 947 267 083 1 667 946 434 752 1 050 182 2 294 726 191 760 1 698 229 23% 28% 32% 27% 30% 29% 1 008 700 1 407 007 1 751 726 1 602 679 1 674 204 1 721 932 25% 32% 35% 28% 32% 32% (50 674) 10 421 91 066 12% 65 267 13% 24 025 20 564 -6% 2% 5% 4% Other Income Total Operating Expenses: Indirect Labour Marketing expenses Indirect Depreciation Other Indirect Costs Research and Development Performance Bonus Training 18 511 1 217 770 481 536 20 864 11 857 664 910 8 850 48 608 1 335 276 882 298 34 244 16 056 373 706 7 631 15 566 1 496 658 973 677 16 226 476 077 29 591 23 702 1 678 586 930 497 24 594 20 358 655 597 9 500 29 502 1 386 706 891 421 6 430 18 485 438 832 2 500 11 787 1 728 226 1 022 791 45 602 31 296 482 715 96 141 40 182 948 140 - 9 500 - - - - 29 754 21 340 38 039 29 038 Operating Surplus Net Finance Income Profit Before Tax Income tax payable Net Profit (241 233) 103 432 (137 801) 35 509 (102 292) 130 759 58 126 188 885 (137 755) 51 131 361 701 36 342 398 043 (303 145) 94 898 13 062 341 025 35 366 376 391 (105 389) 271 002 26 057 - - 13 062 (3 657) 9 405 26 057 (7 296) 18 761 33 SITA SOC Ltd
Statement of Financial Position Statement of Financial Position 34 SITA SOC Ltd
Statement of Financial Position Statement of Financial Position FY 2020/21 FY 2020/21 Audited Audited R'000 R'000 703 918 656 155 656 155 FY 2021/22 FY 2021/22 Budget Budget R'000 R'000 364 713 405 753 405 753 FY 2022/23 FY 2022/23 Estimates Estimates R'000 R'000 439 101 (110 926) 328 175 328 175 Description Description Cash generated in operations Normal taxation Finance income Cash from operating activities Cash from operating activities (91 674) 43 911 (3 657) 44 698 - Cash flows from investing activities Cash flows from investing activities (151 831) (151 831) (689 000) (689 000) (750 000) (750 000) Cash flow from financing activities Cash flow from financing activities (1 312) - - Increase/(decrease) in cash and cash equivalents Cash and cash equivalents beginning of year Cash and cash equivalents end of year Cash and cash equivalents end of year 503 013 1 350 978 1 853 991 1 853 991 (283 247) 1 853 991 1 570 744 1 570 744 (421 825) 1 570 744 1 148 919 1 148 919 35 SITA SOC Ltd
Budget per Programme Budget per Programme Programme 1: Thought-leadership and service delivery Programme 2: Digital infrastructure Programme 3: Skills and capability development Programme 4: Financial sustainability Programme 5: Procurement & industry transformation R 000 Description R 000 R 000 R 000 R 000 Total Revenue: Service Revenue Agency Revenue Total Cost of Sales: Agency Cost of Sales Direct Labour Service Delivery Expenses Direct Depreciation Gross Margin - overall Gross Margin % - overall Gross Margin - services Gross Margin % - services Gross Margin - agency Gross Margin % - agency 2 400 211 2 028 457 371 754 1 760 028 366 110 525 931 753 114 114 872 640 183 3 516 839 3 374 490 142 348 2 414 526 127 428 513 909 1 617 999 155 189 1 102 313 0 0 0 0 0 0 0 0 0 0 0 0 0 0 0 0 0 0 0 0 0 0 0 0 0 0 0 23% 31% 0% 0% 0% 634 539 31% 5 644 1 087 392 0 0 0 32% 0% 0% 0% 14 920 10% 0 0 0 2% 0% 0% 0% Other Income Total Operating Expenses: Indirect Labour Marketing expenses Indirect Depreciation Other Indirect Costs Research and Development Performance Bonus Training 11 787 885 391 433 317 45 085 15 644 245 604 9 500 96 141 40 100 376 575 283 417 236 594 124 053 134 384 109 983 95 282 72 020 514 4 947 87 615 3 5 858 106 683 2 431 21 967 2 416 20 846 82 Operating Surplus Net Finance Income Profit/(Loss) Before Tax Income tax payable Net Profit 263 608 865 719 (873 604) (134 384) (95 282) 263 608 865 719 (873 604) (134 384) (95 282) 263 608 865 719 (873 604) (134 384) (95 282) 36 SITA SOC Ltd
Updated Key Risks Updated Key Risks Outcome Outcome Key risk Key risk Mitigation Mitigation Innovative digital service investments promoting financial sustainability Limited client readiness Limited client readiness Client readiness, both in terms of change and funding, impairs progress with the consequence of not meeting the targeted volume of change within 12 months Targeted engagement with clients through National Consulting Transversal products targeted for modernization, with central decision-making regarding data ownership and central funding negotiated Delivery of use cases to demonstrate impact and efficiency; driving client-initiated AI projects Skills development to ensure both legacy and new development skills are adequate Poor Delivery Poor Delivery Services cannot be delivered on existing infrastructure Dedicated programme risk management by programme managers Develop a long-term investment plan, based on the technology roadmaps (internal and government) and asset lifecycle management Influence a reviewed allocation of transversal-like ICT budgets, through repurposing business case Seamless integrated and trusted public services Limited change management Limited change management Improvement areas not sufficiently supported by change management nor a cohesive programme demonstrating the improvement journey, resulting in customers inability to acknowledge and recognise the stepped-changes implemented. Open communication on various client platforms with clear roadmap of the customer improvement programmes to ensure an appreciation of the scope and timing of change Reinforcement of the planned initiatives, through measuring the improved customer experience as soon as possible after the remediation or launch of a new initiative Enhanced workforce capability solving complex problems and adopting innovative solutions Loss of skills Loss of skills Competitive market conditions with globalisation of digital skills reduce SITA s ability to retain trained/upskilled employees Retention strategies targeting direct and indirect mechanisms of retention Succession planning, mentoring and coaching programmes ensuring a pipeline of skills thus avoiding reliance on key individuals Partnership with industry to ensure digital skills in South Africa is utilized for the benefit of the country Unsupportive culture Unsupportive culture General apathy and unwillingness to support and engage on change Sharing vision and create trust Directed wellness programmes Support employees to rebuild performing culture; i.e. train managers in constructive discipline; Strengthen internal controls (contract management) to prevent irregular expenditure. Roll-out of CLM module Non-performers should be disciplined; treated as misconduct rather than redeployed 37 SITA SOC Ltd
Updated Key Risks Updated Key Risks Outcome Outcome Key risk Key risk Mitigation Mitigation Optimised digital infrastructure Limited Funding Limited Funding Limited appetite for capital intensive projects with long-term, moderate return on investment, delays the implementation of infrastructure modernisation Specific, phased capital investment plans, aligned with shareholder and key client prioritization Alignment of provincial and national requirements to ensure economies of scale in utilization of new infrastructure Leveraging of industry capability for South African benefit Information security exposure Information security exposure Information loss, cyber-attacks and sovereign data loss Security Operating Centre (SOC) implementation Assess and develop data governance methodology and programme to improve data classification process delivery and address compliance obligation of POPI Harden existing security layers (firewalls, patch management, application security) Establish transversal contracts for all Information Security tools. Implement business processes for information storage and retention Reshaping supply chain through ICT economic transformation Develop market intelligence capability within SCM/LOBs to encourage complete and responsive bids, limiting cancellations Commodity based organisational SCM structure Bi-weekly engagement between Customer Operations representatives and SCM to understand client demands and available procurement vehicles; improving on specification development Enhance advocacy role to assist client with architecture planning and hence providing ICT demand plans to SCM Poor market response Poor market response Limitations in regulation, as well as market responsiveness, impair the efficiency of panels and/or the effectiveness of awards, reducing the positive impact of implemented measures on the customer experience, both in terms of turnaround time and cancellations Define end-to-end procurement processes Remedy-9: Implement as full transaction tracker and KPI measurement tool (Case management module). SharePoint: Implement end-to-end file plan to store procurement master file (specifications, procurement transaction records, and contract records). Oracle Contract Management: Implement as contract life-cycle and contract authorizing tool. 5. e-Procurement / gCommerce: Consolidate and implement as complementary digital platforms to manage both Agency and Internal bids Inefficient, ineffective automation Inefficient, ineffective automation Automation tools do not provide full functionality required for highly efficient SCM processes 38 SITA SOC Ltd
Updated Key Risks Updated Key Risks Outcome Outcome Key risk Key risk Mitigation Mitigation Implement efficient transversal/framework agreements and panels for common goods and services Evaluate coverage and gaps of transversal contracts including engagement models. Design new transversal contract BC and Specification for Broadband/Network, End-user computing, Cloud/Server infrastructure, Information Security, IT Service Operations, IT Services) Decide and implement appropriate eSourcing / eProcurement platform for transversal contracts. Establish transversal contracts, load on eProcurement platform. Implement/change management on how to use transversal contracts Digital strategy for broader government and metros (According to Cabinet Memo 38A of 2002, GITOC is accountable for Government wide ICT Strategy; and GITOC has no authority over Local/Municipal matters (this is with SALGA). SITA may play advisory role on this. Target specific government client to grow market share of existing ICT spend Trusted service provider with long term financial sustainability Concentration risk Concentration risk Inability to service SOCs and metros through framework agreements and as an ICT service provider 39 SITA SOC Ltd
THANK YOU THANK YOU 40 SITA SOC Ltd


")