Higher Education Student and Staff Population Statistics
This dataset provides detailed information on student and staff populations in a higher education institution, including undergraduate, MSc, and PhD intakes, along with gender distribution and trends across different academic years. It also includes data on academic staff and professional/technical services staff populations, categorized by gender and pay grade. Additionally, insights into the composition of academic staff at various pay grades over three-year periods are provided.

Download Presentation

Please find below an Image/Link to download the presentation.
The content on the website is provided AS IS for your information and personal use only. It may not be sold, licensed, or shared on other websites without obtaining consent from the author. Download presentation by click this link. If you encounter any issues during the download, it is possible that the publisher has removed the file from their server.
E N D
Presentation Transcript
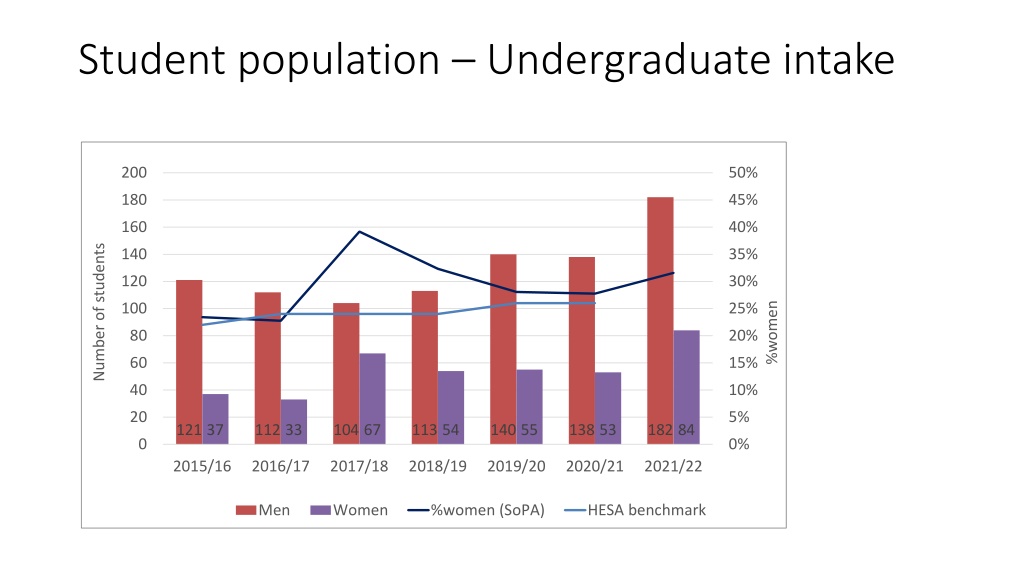
Student population Undergraduate intake 200 50% 180 45% 160 40% Number of students 140 35% 120 30% %women 100 25% 80 20% 60 15% 40 10% 20 5% 121 37 112 33 104 67 113 54 140 55 138 53 182 84 0 0% 2015/16 2016/17 2017/18 2018/19 2019/20 2020/21 2021/22 Men Women %women (SoPA) HESA benchmark
Student population MSc intake 50 35% 45 30% 40 Number of new students 25% 35 30 %women 20% 25 15% 20 15 10% 10 5% 5 42 9 44 8 30 15 31 12 23 11 37 14 25 10 0 0% 2015/16 2016/17 2017/18 2018/19 2019/20 2020/21 2021/22 Men Women % women (SoPA) HESA benchmark
Student population PhD intake 35 45% 40% 30 35% 25 Number of students 30% %women 20 25% 20% 15 15% 10 10% 5 5% 24 11 31 11 32 10 29 14 26 8 24 18 24 15 0 0% 2015/16 2016/17 2017/18 2018/19 2019/20 2020/21 2021/22 Men Women %women HESA benchmark
Academic staff population 180 30% 150 25% 120 20% Number of staff %women 90 15% 60 10% 30 5% 24 119 25 114 26 115 31 126 34 130 37 131 35 144 38 141 40 132 37 135 40 146 51 167 0 0% Total women Total men %women HESA benchmark
Professional and Technical services staff population 70% 60% 50% 40% % women 30% 20% 10% 0% 2013 - 2015 2016 - 2018 2019 - 2021 Professional Services Technical & Scientific
Academic staff population by grade % of academic staff at each UoE paygrade, aggregated into 3 year periods. 100% 7% 8% 18% 90% 21% 22% 25% 25% 26% 21% 21% 80% 14% 13% 70% 16% 22% 17% 19% 9% 18% 21% 60% 18% 50% 22% 18% 21% 18% 40% 30% 59% 53% 50% 48% 20% 40% 38% 37% 36% 10% 0% 2010/11 - 2012/13 2013/14 - 2015/16 2016/17 - 2018/19 2019/20 - 2021/22 2010/11 - 2012/13 2013/14 - 2015/16 2016/17 - 2018/19 2019/20 - 2021/22 Women Men UE07 UE08 UE09 UE10
Professional and Technical services staff population by grade % of Professional Services and Technical staff at each UoE paygrade, aggregated into 3 year periods. 100% 3% 3% 4% 5% 7% 7% 4% 8% 9% 90% 7% 6% 18% 9% 21% 80% 25% 15% 70% 26% 19% 15% 60% 34% 32% 34% 50% 40% 30% 17% 59% 57% 54% 31% 20% 28% 22% 10% 11% 6% 0% 2013 to 2015 2016 to 2018 2019 to 2021 2013 to 2015 2016 to 2018 2019 to 2021 Women Men UE01-05 UE06 UE07 UE08 UE09 UE10