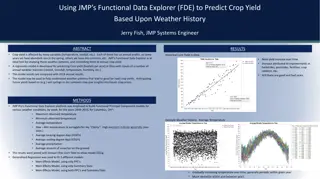
Insights into Global Hemp Crop Areas and Production Trends

Explore data on hemp crop areas and production trends worldwide, excluding North America. The visual representation showcases the distribution of hemp cultivation areas, production percentages by country, Australian industrial hemp production areas, product yields per hectare, and world natural fiber production. Gain valuable insights into the evolving landscape of hemp agriculture.

Download Presentation

Please find below an Image/Link to download the presentation.
The content on the website is provided AS IS for your information and personal use only. It may not be sold, licensed, or shared on other websites without obtaining consent from the author. Download presentation by click this link. If you encounter any issues during the download, it is possible that the publisher has removed the file from their server.
E N D
Presentation Transcript
700,000 600,000 500,000 400,000 Hectares 300,000 200,000 74,307 100,000 0 1961 1963 1965 1967 1969 1971 1973 1975 1977 1979 1981 1983 1985 1987 1989 1991 1993 1995 1997 1999 2001 2003 2005 2007 2009 2011 2013 2015 2017 2019 2021 2021 FAO world crop areas for hemp (hectares) sans North America
Chile 5% 12% China 2% 14% DPR Korea 4% France 1% Germany 3% 2% Lithuania 1% Netherlands 6% Poland Romania 27% Russia Ukraine 23% Other 2021 FAO hemp producing countries (percent area of world 74K Ha) sans North America
2,000 5,000 1,800 4,500 1,600 4,000 1,400 3,500 Australian total area (ha) Western Australia 1,200 3,000 South Australia Hectares Victoria 1,000 2,500 Tasmania New South Wales 800 2,000 Queensland Northern Territory 600 1,500 TOTAL area 400 1,000 200 500 0 0 2016-17 2017/18 2018/19 2019/20 2020/21 2021/22 Crop year Australian industrial hemp production areas since 2016-17 (ha) source Australian Hemp Council (AHC) and the Australian Association of Hemp Regulators
Product yields per ha CROP Grain (t/ha) Flower (t/ha) Fibre (t/ha) Hurd (t/ha) Grain 0.5 3 - 0.3 0.9 <100 Kt/yr 0.9 3 Biomass - - 1.5 2.5 3 5 Dual (grain/biomass) 0.5 1.5 - 0.5 1 2.5 3.5 Dual (flower/biomass) - 1 1.5 (10 50 kg of CBD/ha) 0.5 1 2.5 3.5 - Cotton 4 2.7 (average) 25 Mt/yr -
World natural fibre (vegetable) production 30,000,000 25,000,000 20,000,000 Metric tonnes 15,000,000 10,000,000 5,000,000 0 2008 2009 2010 2011 2012 2013 2014 2015 est Cotton Jute & Kenaf Coir Flax fibre & tow Bast (other) Sisal Ramie Abaca Kapok Hemp tow


 production")