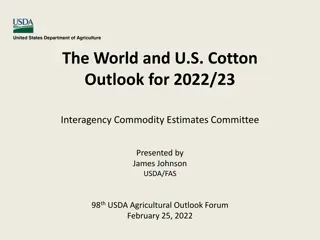
Overview of U.S. Petroleum and Natural Gas Production Trends

This detailed content discusses the production and consumption of crude oil, natural gas plant liquids, and petroleum liquids in the United States. It covers historical data, projections, economic growth scenarios, and price cases for the period up to 2050. The information sheds light on production trends, consumption patterns, and supply balances in the energy sector.

Download Presentation

Please find below an Image/Link to download the presentation.
The content on the website is provided AS IS for your information and personal use only. It may not be sold, licensed, or shared on other websites without obtaining consent from the author. Download presentation by click this link. If you encounter any issues during the download, it is possible that the publisher has removed the file from their server.
E N D
Presentation Transcript
Production of U.S. crude oil and natural gas plant liquids U.S. crude oil production AEO2022 Reference case and side cases million barrels per day U.S. natural gas plant liquids production AEO2022 Reference case and side cases million barrels per day 2021 history projections 2021 25 25 history projections High Oil Price High Oil and Gas Supply 20 20 15 15 Reference High Oil and Gas Supply High Oil Price Reference Low Oil Price Low Oil and Gas Supply 10 10 Low Oil Price Low Oil and Gas Supply 5 5 0 0 2010 2020 2030 2040 2050 2010 2020 2030 2040 2050 2 Source: U.S. Energy Information Administration, Annual Energy Outlook 2022 (AEO2022) www.eia.gov/aeo
U.S. crude oil and natural gas plant liquids production and consumption Crude oil and natural gas plant liquids production AEO2022 oil and natural gas supply cases million barrels per day Petroleum liquids consumption AEO2022 economic growth cases million barrels per day 2021 2021 30 30 High Oil and Gas Supply history projections history projections High Economic Growth Reference Low Economic Growth 25 25 20 20 Reference Reference, crude oil only Low Oil and Gas Supply 15 15 10 10 5 5 0 0 2000 2010 2020 2030 2040 2050 2000 2010 2020 2030 2040 2050 Note: Petroleum liquids does not include biofuels. 3 Source: U.S. Energy Information Administration, Annual Energy Outlook 2022 (AEO2022) www.eia.gov/aeo
U.S. petroleum, other liquids, and natural gas production and consumption Natural gas balance AEO2022 Reference case trillion cubic feet Petroleum and other liquids balance AEO2022 Reference case million barrels per day 2021 2021 45 25 production history projections history projections production 40 20 35 consumption 30 consumption 15 25 20 10 15 10 5 5 0 0 2000 2010 2020 2030 2040 2050 2000 2010 2020 2030 2040 2050 4 Source: U.S. Energy Information Administration, Annual Energy Outlook 2022 (AEO2022) www.eia.gov/aeo
U.S. crude oil production Crude oil production, AEO2022 oil price cases Reference case million barrels per day Low Oil Price case million barrels per day High Oil Price case million barrels per day 2021 2021 2021 25 25 25 history projections history projections history projections 20 20 20 15 15 15 tight oil tight oil 10 10 10 tight oil 5 5 5 Alaska Gulf of Mexico other Alaska Gulf of Mexico other Alaska Gulf of Mexico other 0 0 0 2010 2020 2030 2040 2050 2010 2020 2030 2040 2050 2010 2020 2030 2040 2050 5 Source: U.S. Energy Information Administration, Annual Energy Outlook 2022 (AEO2022) www.eia.gov/aeo
U.S. crude oil production Crude oil production by play AEO2022 Reference case million barrels per day 2021 15 history projections tight oil Wolfcamp Bone Springs/ Avalon Spraberry Eagle Ford Bakken Niobrara other tight oil Alaska Gulf of Mexico other 10 5 0 2000 2010 2020 2030 2040 2050 6 Source: U.S. Energy Information Administration, Annual Energy Outlook 2022 (AEO2022) www.eia.gov/aeo
Onshore crude oil production in the Lower 48 states Onshore crude oil production in the Lower 48 states AEO2022 Reference case million barrels per day 2021 6 history projections Southwest 5 4 3 Northern Great Plains Gulf Coast Rocky Mountains Midcontinent East West Coast 2 1 0 2000 2010 2020 2030 2040 2050 7 Source: U.S. Energy Information Administration, Annual Energy Outlook 2022 (AEO2022) www.eia.gov/aeo
U.S. natural gas plant liquids production by region and type Natural gas plant liquids production by type AEO2022 Reference case million barrels per day Natural gas plant liquids production by region AEO2022 Reference case million barrels per day 2021 2021 8 8 history projections history projections 7 7 natural gasoline 6 East 6 isobutane normal butane 5 5 Southwest 4 4 propane 3 3 2 2 ethane rest of United 1 1 States 0 0 2000 2010 2020 2030 2040 2050 2000 2010 2020 2030 2040 2050 8 Source: U.S. Energy Information Administration, Annual Energy Outlook 2022 (AEO2022) www.eia.gov/aeo
U.S. refinery capacity Refinery capacity AEO2022 Reference case million barrels per day 2021 20 history projections 19 18 17 16 15 2010 2020 2030 2040 2050 9 Source: U.S. Energy Information Administration, Annual Energy Outlook 2022 (AEO2022) www.eia.gov/aeo
U.S. crude oil supply and refinery utilization Refinery utilization AEO2022 Reference case percentage Crude oil supply to domestic refineries AEO2022 Reference case million barrels per day 2021 history projections 2021 95% 18 history projections 17 90% 16 85% 15 80% 14 13 75% 2010 2020 2030 2040 2050 2010 2020 2030 2040 2050 10 Source: U.S. Energy Information Administration, Annual Energy Outlook 2022 (AEO2022) www.eia.gov/aeo
U.S. crude and petroleum and other liquids trade Total petroleum and other liquids trade AEO2022 Reference case million barrels per day Crude oil trade AEO2022 Reference case million barrels per day 2021 2021 16 16 history projections history projections 12 12 imports imports 8 8 4 4 net imports net imports 0 0 2010 2020 2030 2040 2050 2010 2020 2030 2040 2050 -4 -4 exports exports -8 -8 -12 -12 11 Source: U.S. Energy Information Administration, Annual Energy Outlook 2022 (AEO2022) www.eia.gov/aeo
U.S. petroleum and other liquids trade Petroleum and other liquids net exports AEO2022 side cases million barrels per day 2021 15 history projections 10 High Oil Price High Oil and Gas Supply 5 Reference 0 Low Oil Price Low Oil and Gas Supply -5 -10 -15 2000 2010 2020 2030 2040 2050 12 Source: U.S. Energy Information Administration, Annual Energy Outlook 2022 (AEO2022) www.eia.gov/aeo
U.S. motor gasoline and diesel prices Retail prices of motor gasoline AEO2022 oil price cases 2021 dollars per gallon Retail prices of diesel AEO2022 oil price cases 2021 dollars per gallon 2021 2021 $6 $6 history projections High Oil Price history projections $5 $5 High Oil Price $4 $4 Reference Reference $3 $3 Low Oil Price Low Oil Price $2 $2 $1 $1 $0 $0 2000 2010 2020 2030 2040 2050 2000 2010 2020 2030 2040 2050 13 Source: U.S. Energy Information Administration, Annual Energy Outlook 2022 (AEO2022) www.eia.gov/aeo
U.S. biofuels production Biofuels production, AEO2022 oil price cases Reference case million barrels per day Low Oil Price case million barrels per day 2.0 history projections High Oil Price case million barrels per day 2021 2021 2021 2.0 2.0 history projections history projections biomass-based diesel 1.5 biomass-based diesel 1.5 biomass-based diesel 1.5 1.0 1.0 1.0 total ethanol total ethanol total ethanol 0.5 0.5 0.5 0.0 0.0 0.0 2010 2020 2030 2040 2050 2010 2020 2030 2040 2050 2010 2020 2030 2040 2050 Note: Other biofuels make up less than 0.2% of biofuel production and are therefore not visible. 14 Source: U.S. Energy Information Administration, Annual Energy Outlook 2022 (AEO2022) www.eia.gov/aeo
U.S. biomass-based diesel production Biomass-based diesel production as a percentage of petroleum diesel production AEO2022 Reference case percentage 2021 history projections Biomass-based diesel production AEO2022 Reference case million barrels per day 2021 history projections 0.25 10% 0.20 8% renewable diesel 0.15 6% 0.10 4% biodiesel 0.05 2% 0.00 0% 2010 2020 2030 2040 2050 2010 2020 2030 2040 2050 15 Source: U.S. Energy Information Administration, Annual Energy Outlook 2022 (AEO2022) www.eia.gov/aeo
U.S. biofuels consumption Energy-related biofuels consumptionAEO2022 Reference case million barrels per day 2021 2.0 history projections 1.5 biomass-based diesel 1.0 total ethanol 0.5 0.0 2010 2020 2030 2040 2050 16 Source: U.S. Energy Information Administration, Annual Energy Outlook 2022 (AEO2022) www.eia.gov/aeo
U.S. ethanol and motor gasoline consumption U.S. motor gasoline consumption AEO2022 Reference case million barrels per day U.S. ethanol consumption AEO2022 Reference case million barrels per day 2021 2021 1.4 14 history projections history projections 1.2 12 1.0 10 0.8 8 0.6 6 0.4 4 0.2 2 0.0 0 2000 2010 2020 2030 2040 2050 2000 2010 2020 2030 2040 2050 17 Source: U.S. Energy Information Administration, Annual Energy Outlook 2022 (AEO2022) www.eia.gov/aeo
Biofuels as a percentage of U.S. motor gasoline and diesel consumption Biofuels percentage of gasoline and diesel consumption AEO2022 oil price cases percentage High Oil Price 2021 15% history projections Reference 10% Low Oil Price 5% 0% 2010 2020 2030 2040 2050 18 Source: U.S. Energy Information Administration, Annual Energy Outlook 2022 (AEO2022) www.eia.gov/aeo