Insights into US Natural Gas Production and Consumption Trends

 undefined

Natural gas


U
.
S
.
d
r
y
n
a
t
u
r
a
l
g
a
s
p
r
o
d
u
c
t
i
o
n
A
E
O
2
0
2
1
s
i
d
e
c
a
s
e
s
trillion cubic feet
U
.
S
.
n
a
t
u
r
a
l
g
a
s
c
o
n
s
u
m
p
t
i
o
n
A
E
O
2
0
2
1
s
i
d
e
c
a
s
e
s
trillion cubic feet
U.S. dry natural gas p
rodu
ction and consumption
2

2
0
2
0
history projections
2
0
2
0
history projections
H
i
g
h
O
i
l
a
n
d
G
a
s
S
u
p
p
l
y
H
i
g
h
O
i
l
P
r
i
c
e
R
e
f
e
r
e
n
c
e
L
o
w
O
i
l
P
r
i
c
e
L
o
w
O
i
l
a
n
d
G
a
s
S
u
p
p
l
y
U
.
S
.
d
r
y
n
a
t
u
r
a
l
g
a
s
p
r
o
d
u
c
t
i
o
n
A
E
O
2
0
2
1
o
i
l
a
n
d
g
a
s
s
u
p
p
l
y
c
a
s
e
s
trillion cubic feet
N
a
t
u
r
a
l
g
a
s
s
p
o
t
p
r
i
c
e
a
t
H
e
n
r
y
H
u
b
A
E
O
2
0
2
1
o
i
l
a
n
d
g
a
s
s
u
p
p
l
y
c
a
s
e
s
2020 dollars per million British thermal units
Natural gas production and prices
3
R
e
f
e
r
e
n
c
e
c
a
s
e
trillion cubic feet
L
o
w
O
i
l
a
n
d
G
a
s
S
u
p
p
l
y
c
a
s
e
trillion cubic feet
U.S. dry natural gas production by type
4
H
i
g
h
O
i
l
a
n
d
G
a
s
S
u
p
p
l
y
c
a
s
e
trillion cubic feet
t
i
g
h
t
/
s
h
a
l
e
g
a
s
o
t
h
e
r
L
o
w
e
r
4
8
s
t
a
t
e
s
o
n
s
h
o
r
e
L
o
w
e
r
4
8
s
t
a
t
e
s
o
f
f
s
h
o
r
e
o
t
h
e
r
U
.
S
.
d
r
y
n
a
t
u
r
a
l
g
a
s
p
r
o
d
u
c
t
i
o
n
b
y
t
y
p
e
,
A
E
O
2
0
2
1
o
i
l
a
n
d
g
a
s
s
u
p
p
l
y
c
a
s
e
s
R
e
f
e
r
e
n
c
e
c
a
s
e
trillion cubic feet
L
o
w
O
i
l
a
n
d
G
a
s
S
u
p
p
l
y
c
a
s
e
trillion cubic feet
U.S. production of natural gas from shale resources
5
H
i
g
h
O
i
l
a
n
d
G
a
s
S
u
p
p
l
y
c
a
s
e
trillion cubic feet
2
0
2
0
history projections
U
.
S
.
d
r
y
n
a
t
u
r
a
l
g
a
s
p
r
o
d
u
c
t
i
o
n
f
r
o
m
s
h
a
l
e
r
e
s
o
u
r
c
e
s
b
y
r
e
g
i
o
n
,
A
E
O
2
0
2
1
o
i
l
a
n
d
g
a
s
s
u
p
p
l
y
c
a
s
e
s
r
e
s
t
o
f
U
n
i
t
e
d
S
t
a
t
e
s
R
e
f
e
r
e
n
c
e
c
a
s
e
trillion cubic feet
U.S. production of natural gas from oil formations
6
H
i
g
h
O
i
l
a
n
d
G
a
s
S
u
p
p
l
y
c
a
s
e
trillion cubic feet
L
o
w
O
i
l
a
n
d
G
a
s
S
u
p
p
l
y
c
a
s
e
trillion cubic feet
U
.
S
.
d
r
y
n
a
t
u
r
a
l
g
a
s
p
r
o
d
u
c
t
i
o
n
f
r
o
m
o
i
l
f
o
r
m
a
t
i
o
n
s
b
y
r
e
g
i
o
n
,
A
E
O
2
0
2
1
o
i
l
a
n
d
g
a
s
s
u
p
p
l
y
c
a
s
e
s
N
a
t
u
r
a
l
g
a
s
c
o
n
s
u
m
p
t
i
o
n
b
y
s
e
c
t
o
r
,
A
E
O
2
0
2
1
R
e
f
e
r
e
n
c
e
c
a
s
e
trillion cubic feet
billion cubic feet per day
U.S. natural gas consumption by sector
7
2
0
2
0
history
projections
Change in natural gas disposition by sector and net exports
8
e
l
e
c
t
r
i
c
p
o
w
e
r
c
o
m
m
e
r
c
i
a
l
r
e
s
i
d
e
n
t
i
a
l
t
r
a
n
s
p
o
r
t
a
t
i
o
n
i
n
d
u
s
t
r
i
a
l
n
e
t
e
x
p
o
r
t
s
N
a
t
u
r
a
l
g
a
s
d
i
s
p
o
s
i
t
i
o
n
b
y
s
e
c
t
o
r
a
n
d
n
e
t
e
x
p
o
r
t
s
A
E
O
2
0
2
1
R
e
f
e
r
e
n
c
e
c
a
s
e
trillion cubic feet
C
h
a
n
g
e
i
n
n
a
t
u
r
a
l
g
a
s
d
i
s
p
o
s
i
t
i
o
n
a
n
d
n
e
t
e
x
p
o
r
t
s
A
E
O
2
0
2
1
R
e
f
e
r
e
n
c
e
c
a
s
e
relative to 2020 in trillion cubic feet
e
l
e
c
t
r
i
c
p
o
w
e
r
c
o
m
m
e
r
c
i
a
l
t
r
a
n
s
p
o
r
t
a
t
i
o
n
i
n
d
u
s
t
r
i
a
l
n
e
t
e
x
p
o
r
t
s
r
e
s
i
d
e
n
t
i
a
l
U.S. natural gas and liquefied natural gas (LNG) trade
9
R
e
f
e
r
e
n
c
e
c
a
s
e
trillion cubic feet
(Tcf)
U
.
S
.
n
a
t
u
r
a
l
g
a
s
a
n
d
L
N
G
t
r
a
d
e
,
A
E
O
2
0
2
1
o
i
l
a
n
d
g
a
s
s
u
p
p
l
y
c
a
s
e
s
L
o
w
O
i
l
a
n
d
G
a
s
S
u
p
p
l
y
c
a
s
e
Tcf
H
i
g
h
O
i
l
a
n
d
G
a
s
S
u
p
p
l
y
c
a
s
e
billion cubic feet per day
Tcf (Bcf/d)
L
N
G
e
x
p
o
r
t
s
n
e
t
e
x
p
o
r
t
s
p
i
p
e
l
i
n
e
e
x
p
o
r
t
s
t
o
M
e
x
i
c
o
p
i
p
e
l
i
n
e
e
x
p
o
r
t
s
t
o
C
a
n
a
d
a
p
i
p
e
l
i
n
e
i
m
p
o
r
t
s
f
r
o
m
C
a
n
a
d
a
L
N
G
i
m
p
o
r
t
s
U
.
S
.
l
i
q
u
e
f
i
e
d
n
a
t
u
r
a
l
g
a
s
e
x
p
o
r
t
s
A
E
O
2
0
2
1
s
u
p
p
l
y
a
n
d
p
r
i
c
e
c
a
s
e
s
trillion cubic feet
R
a
t
i
o
o
f
B
r
e
n
t
c
r
u
d
e
o
i
l
p
r
i
c
e
t
o
n
a
t
u
r
a
l
g
a
s
p
r
i
c
e
a
t
H
e
n
r
y
H
u
b
,
A
E
O
2
0
2
1
s
u
p
p
l
y
a
n
d
p
r
i
c
e
c
a
s
e
s
energy-equivalent terms
U.S. liquefied natural gas (LNG) exports and oil and natural gas
prices
10
2
0
2
0
history
projections
H
i
g
h
O
i
l
P
r
i
c
e
H
i
g
h
O
i
l
a
n
d
G
a
s
S
u
p
p
l
y
R
e
f
e
r
e
n
c
e
L
o
w
O
i
l
a
n
d
G
a
s
S
u
p
p
l
y
L
o
w
O
i
l
P
r
i
c
e
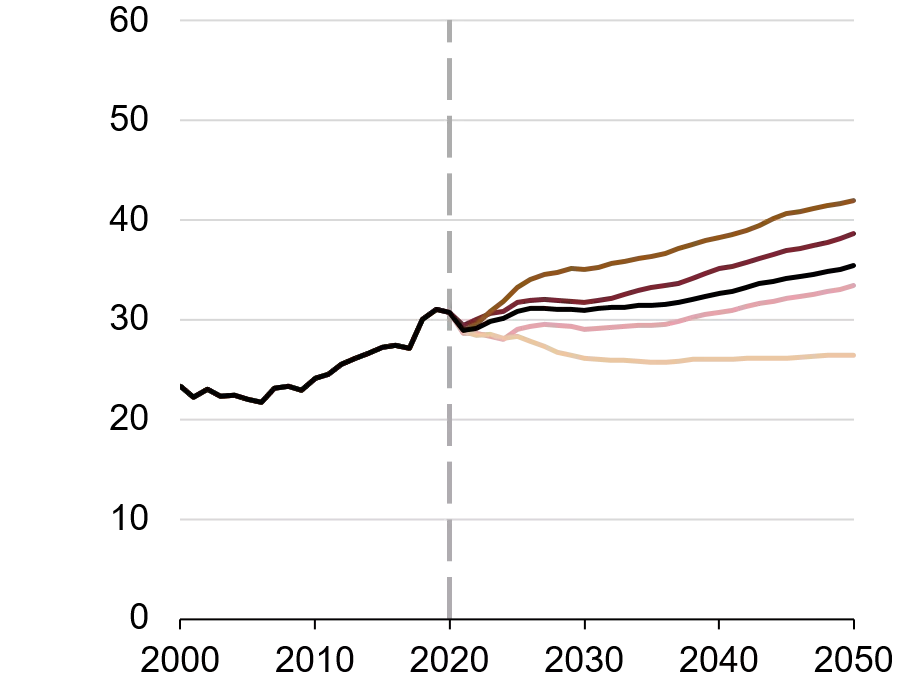
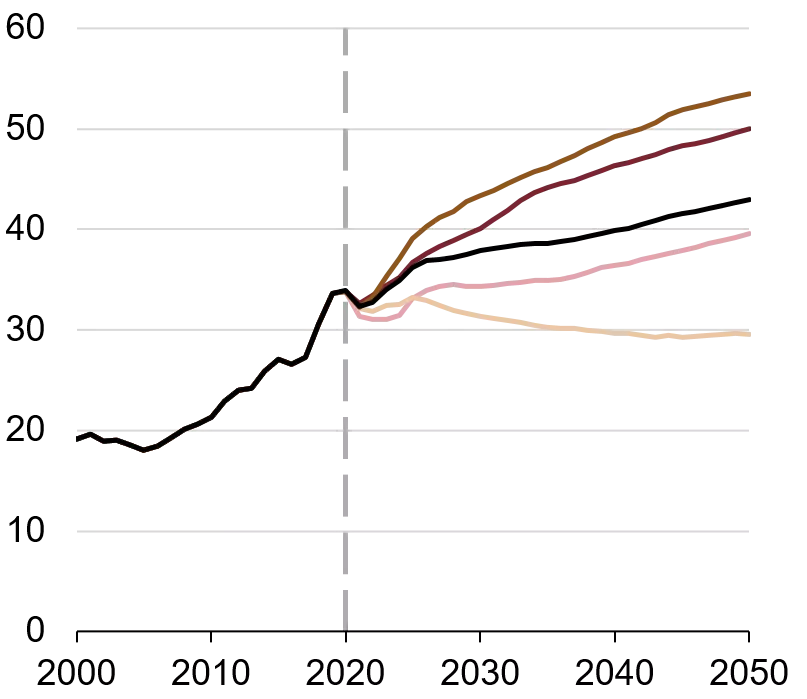
This data compilation showcases the production, consumption, pricing, and regional breakdown of natural gas in the United States, as projected in the Annual Energy Outlook 2021 (AEO2021). It includes historical data, future projections, spot prices at Henry Hub, and production breakdown by type and region. The visual representations provide a comprehensive overview of the trends and forecasts in the US natural gas sector.

Download Presentation

Please find below an Image/Link to download the presentation.
The content on the website is provided AS IS for your information and personal use only. It may not be sold, licensed, or shared on other websites without obtaining consent from the author. Download presentation by click this link. If you encounter any issues during the download, it is possible that the publisher has removed the file from their server.
E N D
Presentation Transcript
U.S. dry natural gas production and consumption U.S. dry natural gas production AEO2021 side cases trillion cubic feet U.S. natural gas consumption AEO2021 side cases trillion cubic feet 2020 2020 60 60 history projections history projections High Oil and Gas Supply High Oil Price Reference Low Oil Price Low Oil and Gas Supply 50 50 40 40 30 30 20 20 10 10 0 0 2000 2010 2020 2030 2040 2050 2000 2010 2020 2030 2040 2050 2 Source: U.S. Energy Information Administration, Annual Energy Outlook 2021 (AEO2021) www.eia.gov/aeo
Natural gas production and prices U.S. dry natural gas production AEO2021 oil and gas supply cases trillion cubic feet Natural gas spot price at Henry Hub AEO2021 oil and gas supply cases 2020 dollars per million British thermal units 2020 2020 $12 60 history projections history projections Low Oil and Gas Supply Reference High Oil and Gas Supply $10 50 $8 40 $6 30 High Oil and Gas Supply Reference Low Oil and Gas Supply $4 20 $2 10 $0 0 2000 2010 2020 2030 2040 2050 2000 2010 2020 2030 2040 2050 3 Source: U.S. Energy Information Administration, Annual Energy Outlook 2021 (AEO2021) www.eia.gov/aeo
U.S. dry natural gas production by type U.S. dry natural gas production by type, AEO2021 oil and gas supply cases Reference case trillion cubic feet Low Oil and Gas Supply case trillion cubic feet High Oil and Gas Supply case trillion cubic feet 2020 2020 2020 60 60 60 history projections history projections history projections 50 50 50 40 40 40 tight/ shale gas other Lower 48 states onshore Lower 48 states offshore other 30 30 30 20 20 20 10 10 10 0 0 0 2000 2010 2020 2030 2040 2050 2000 2010 2020 2030 2040 2050 2000 2010 2020 2030 2040 2050 4 Source: U.S. Energy Information Administration, Annual Energy Outlook 2021 (AEO2021) www.eia.gov/aeo
U.S. production of natural gas from shale resources U.S. dry natural gas production from shale resources by region, AEO2021 oil and gas supply cases Reference case trillion cubic feet Low Oil and Gas Supply case trillion cubic feet 2020 history projections High Oil and Gas Supply case trillion cubic feet 2020 history projections 2020 45 45 45 history projections 40 40 40 35 35 35 30 30 30 Southwest 25 25 25 20 20 20 East 15 15 15 10 10 10 Gulf Coast 5 5 5 rest of United States 0 0 0 2010 2020 2030 2040 2050 2010 2020 2030 2040 2050 2010 2020 2030 2040 2050 5 Source: U.S. Energy Information Administration, Annual Energy Outlook 2021 (AEO2021) www.eia.gov/aeo
U.S. production of natural gas from oil formations U.S. dry natural gas production from oil formations by region, AEO2021 oil and gas supply cases Reference case trillion cubic feet Low Oil and Gas Supply case trillion cubic feet High Oil and Gas Supply case trillion cubic feet 2020 2020 2020 14 14 14 history projections history projections history projections 12 12 12 10 10 10 8 8 8 6 6 6 Southwest 4 4 4 Gulf Coast 2 2 2 other 0 0 0 2010 2020 2030 2040 2050 2010 2020 2030 2040 2050 2010 2020 2030 2040 2050 6 Source: U.S. Energy Information Administration, Annual Energy Outlook 2021 (AEO2021) www.eia.gov/aeo
U.S. natural gas consumption by sector Natural gas consumption by sector, AEO2021 Reference case trillion cubic feet billion cubic feet per day 2020 40 history projections 35 30 electric power 25 commercial 20 residential transportation 15 industrial liquefaction lease and plant other 10 5 0 2000 2010 2020 2030 2040 2050 7 Source: U.S. Energy Information Administration, Annual Energy Outlook 2021 (AEO2021) www.eia.gov/aeo
Change in natural gas disposition by sector and net exports Natural gas disposition by sector and net exports AEO2021 Reference case trillion cubic feet Change in natural gas disposition and net exports AEO2021 Reference case relative to 2020 in trillion cubic feet 45 12 40 10 35 8 electric power commercial residential transportation industrial net exports electric power commercial transportation industrial net exports residential 30 6 25 20 4 15 2 10 0 5 -2 0 2020 2030 2040 2050 2020 2030 2040 2050 8 Source: U.S. Energy Information Administration, Annual Energy Outlook 2021 (AEO2021) www.eia.gov/aeo
U.S. natural gas and liquefied natural gas (LNG) trade U.S. natural gas and LNG trade, AEO2021 oil and gas supply cases High Oil and Gas Supply case billion cubic feet per day Tcf (Bcf/d) Reference case trillion cubic feet (Tcf) 15 history projections Low Oil and Gas Supply case Tcf 2020 2020 2020 15 41.1 15 41.1 history projections history projections 10 10 27.4 LNG exports net exports pipeline exports to Mexico 10 27.4 5 5 13.7 pipeline exports to Canada pipeline imports 5 13.7 0 0.0 from Canada LNG imports 0 0 0.0 -5 -5 -13.7 -5 -13.7 2010 2020 2030 2040 2050 2010 2020 2030 2040 2050 2010 2020 2030 2040 2050 9 Source: U.S. Energy Information Administration, Annual Energy Outlook 2021 (AEO2021) www.eia.gov/aeo
U.S. liquefied natural gas (LNG) exports and oil and natural gas prices Ratio of Brent crude oil price to natural gas price at Henry Hub, AEO2021 supply and price cases energy-equivalent terms 2020 history projections U.S. liquefied natural gas exports AEO2021 supply and price cases trillion cubic feet 2020 15 10 history projections 8 High Oil Price High Oil and Gas Supply Reference Low Oil and Gas Supply Low Oil Price 10 6 4 5 2 0 0 2000 2010 2020 2030 2040 2050 2000 2010 2020 2030 2040 2050 10 Source: U.S. Energy Information Administration, Annual Energy Outlook 2021 (AEO2021) www.eia.gov/aeo


 trade")
 exports and oil and natural")