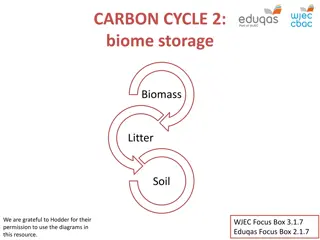
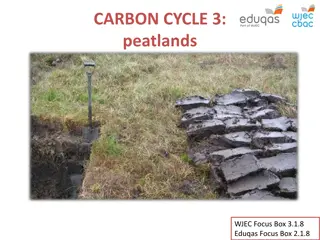
Carbon Modification by Seabirds in Fjords: Implications and Patterns
The study investigates the impact of seabirds on carbon burial in fjords, showcasing factors such as wind stress patterns, terrestrial vegetation biomass, and various carbon sources in the ecosystem. It delves into the distribution and fate of carbon in two fjords, Hornsund and Kongsfjorden, shedding light on the role of different organisms and processes in shaping carbon dynamics within these ecosystems. The research highlights how seabird consumption plays a significant role in carbon turnover and sediment accumulation, providing valuable insights into the intricate interactions within the fjord environments.

Download Presentation

Please find below an Image/Link to download the presentation.
The content on the website is provided AS IS for your information and personal use only. It may not be sold, licensed, or shared on other websites without obtaining consent from the author. Download presentation by click this link. If you encounter any issues during the download, it is possible that the publisher has removed the file from their server.
E N D
Presentation Transcript
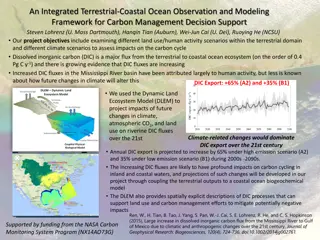
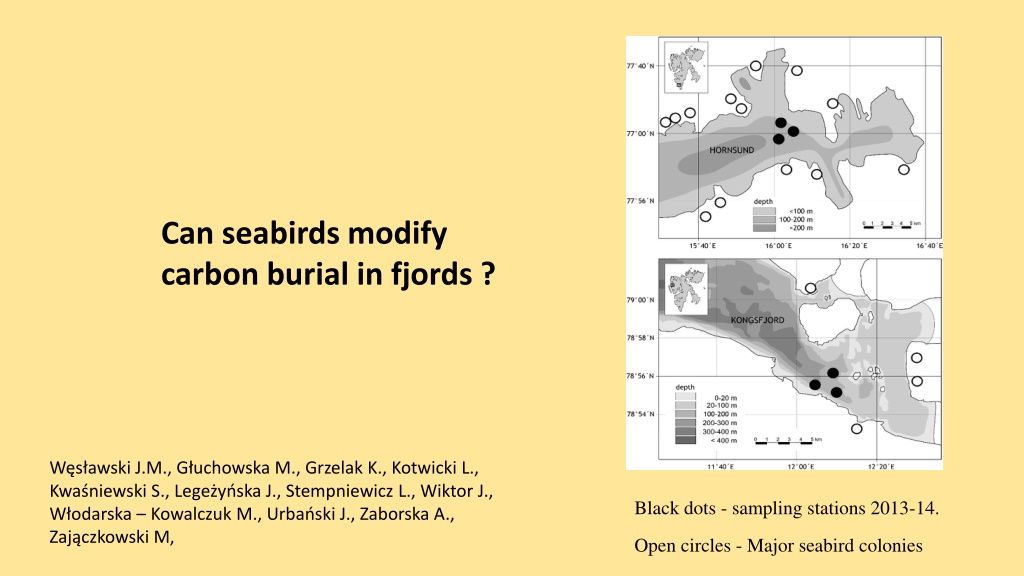
Can seabirds modify carbon burial in fjords ? W s awski J.M., G uchowska M., Grzelak K., Kotwicki L., Kwa niewski S., Lege y ska J., Stempniewicz L., Wiktor J., W odarska Kowalczuk M., Urba ski J., Zaborska A., Zaj czkowski M, Black dots - sampling stations 2013-14. Open circles - Major seabird colonies
The surface wind stress (arrows) and wind stress curl (contoured colors) pattern in Fram Strait and the oceans surrounding Svalbard (Barents Sea, Greenland Sea and the Arctic Ocean) after Nilsen et al. 2016
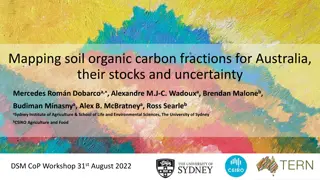
Types of terrestrial vegetation used for biomass calculations in Hornsund and Kongsfjorden 595 tons of carbon 266 tons of carbon Landsart 8 (Digital Elevation Model of Svalbard) images with spatial resolution of 20m were acqiured from GloVis Viewer programe .
Carbon sources in both fjords (summer values of biomass) Total carbon content in brackets Biomass source Microplankton g C/m2 (100m water column) Hornsund 0,8 (94 ton C) Kongsfjord 2,5 (70 t C) Mesozooplankton g C/m3 Macroplankton g C m3 0,050 (549 t C) 0,075 (893 t C) 0,040 (140 t C) 0,135 (415 t C) Fish ton C/fjord 2,2 18,8 Pelagic microbs g C/m2 (100m water column) 1,2 0,7 Meiofauna g C/m2(upper 1cm) 0,45 (58 t C) 0,2 (63 t C) Macrofauna g C /m2 Benthic microbs g C/m2 (upper 1cm) 4 (791 t C) 10 (1413 t C) 0,11 0,52 Macroalgae ton C/fjord 1282 1936 Terrestrial vegetation ton C/fjord watershed 600 290 Sea birds consumption in July (30 days) ton C/ fjord 5573 3047 Organic carbon in suspensions mg C/dm3 0,19 0,33
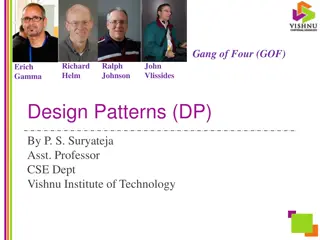
Percent share of biomass in water column - in g C/m3 Percent share of organic carbon in sediment - in g C/m2 HORNSUND HORNSUND bacteria 1.1 2.35.7 microplankton 0.1 10.9 7.3 45.5 36.4 45.5 mesozooplankton 45.5 macroplankton bacteria meiofauna macrofauna fish macroalgae microphytobenthos KONGSFJORDEN KONGSFJORD 2.7 0.5 1.1 0.5 3.2 1.1 42.6 bacteria 34.1 53.2 microplankton 61.4 mesozooplankton macroplankton bacteria meiofauna macrofauna fish macroalgae microphytobenthos
Carbon fate in both fjords modified from Zaborska et al .2016 Process Hornsund Kongsfjord Carbon content in sediment g C/m3 (upper 1 cm) Carbon content in sediment mg/g 252,4 98,3 14,2 5,46 Carbon accumulation g C/m2/year (upper 1 cm) 42,6 32,5 Mass accumulation rate of sediment g/m2/year 3041 5947 Carbon burial g C/m2/year 41,4 16,3 Carbon mineralization (in top 20cm) g C/m2/year 1,3 (3%) 16,2 (50%)
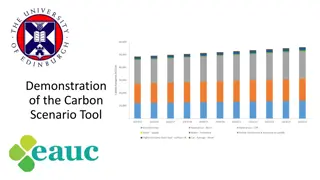
Degree of organic matter decomposition in surface sediments, modified from Zaborska et al 2016. Origin and degree of degradation of organic matter in surface sediments, modified from Zaborska et al. 2016. C / N org tot 7 9 11 13 15 0 2 Marine derived matter 4 Depth in sediment [cm] 6 VPDB 8 10 C 12 13 14 16 Land derived matter 18 20 C / N org 22 tot

 and wind stress curl")

")