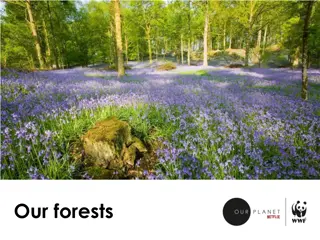
Enhancing Emissions Reduction and Carbon Sequestration in Forests

This presentation discusses the importance of implementing mitigation strategies in forests to reduce emissions and enhance carbon removal. It highlights the benefits of intact/restored ecosystems, carbon sequestration as an ecosystem service, and the carbon stocks in tropical forests. The focus is on the significance of acting now to protect these valuable ecosystems.

Download Presentation

Please find below an Image/Link to download the presentation.
The content on the website is provided AS IS for your information and personal use only. It may not be sold, licensed, or shared on other websites without obtaining consent from the author. Download presentation by click this link. If you encounter any issues during the download, it is possible that the publisher has removed the file from their server.
E N D
Presentation Transcript
TopicC1. Reducing emissions and enhancing removals (land-use change, fire, drainage) J Boone Kauffman and Daniel Murdiyarso
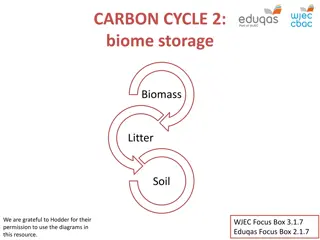
Topic C1. Slide 2 of 21 Implementing mitigation (emissions reduction) strategies in forests Why it is important to act now? Intact/Restored ecosystems: are more buffered (resistant) to collapse or decline with a changing climate or other stresses; have a higher degree of resilience the capacity to recover following stress or disturbance; will provide more ecosystem services e.g. biodiversity, water quality, aesthetics and carbon storage; may be of value and interest for carbon financing for climate change mitigation
Topic C1. Slide 3 of 21 Carbon sequestration is an ecosystem service that has not received value until recently Net primary productivity (NPP) - The net amount of fixed C in organic matter by photosynthesis after the needs of the plant have been met. GPP- Respiration = NPP About 95% of CO2 emissions would occur if humans did not exist on Earth - natural decay of plant materials is about 220 billion tonnes of CO2 each year.
Topic C1. Slide 4 of 21 Tropical forested wetlands are ecosystems that are inundated or saturated by surface or groundwater at a frequency and duration sufficient to support a prevalence of forest vegetation typically adapted for life in saturated soil conditions (e.g. mangroves, freshwater swamps, floodplain forests).
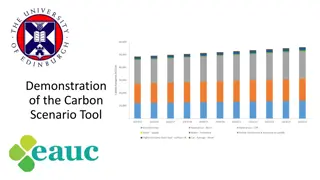
Topic C1. Slide 5 of 21 How much carbon can be found in forests? Examples of ecosystem C stocks of tropical forests Carbon Mg/ha) 2500 2000 1500 1000 500 Aboveground 0 Belowground Donato et al. 2011, Kauffman et al. In press, Kauffman et al 2003.
Topic C1. Slide 6 of 21 An example of forest carbon stocks: Tropical forests and mangroves of Costa Rica 1200 1000 Mg/ha 1000 C mass (Mg/ha) 800 400 Mg/ha Aboveground Soil 0-10cm Soil 10-20cm 600 Soil 20-30cm Soil 30-50cm Soil 50-100cm 400 200 0 Dry Moist Wet Rainforest Mangrove Dry Forest Moist forest premontane wet trans wet forest Premontane wet premontane rain lower montane rain Mangrove Kauffman et al. (In press).
Topic C1. Slide 7 of 21 Kauffman et al. (2014) Ecological Applications
Topic C1. Slide 8 of 21 We need to determine the pathways and processes of emissions
Topic C1. Slide 9 of 21 Currently, on average, between 1-7% of blue carbon sinks are being lost annually Upstream disruptions Aquaculture Road development/ hydrological disruptions Coastal development Rice/Agriculture
Topic C1. Slide 10 of 21 Currently, the impacts of land use/land cover change are impacting biodiversity to a much greater extent than global climate change
Topic C1. Slide 11 of 21 Global loss of blue carbon sinks (total % loss and annual rate of loss) Global area (km2) Global loss Annual rate of ecosystem loss (%)/year References Mangroves 137,760-152-361 20% (since 1980s) 30 50% (since 1940s) 0.7 3% Valiela et al. (2001); Alongi (2002); FAO (2007); Spalding et al. (2010) Sea grass 177,000 600,000 50% (since 1990s) ~7% Costanza et al. (1997); Duarte et al. (2005); Waycott et al. (2009) Salt marshes 20,000 400,000 Salt marshes 25% (since 1800s) 1 2% Bridgham et al. (2006); Duarte et al. (2008) Adapted from Mcleod et al. ( 2011) Area of the worlds forests = 39 million km (Pan et al. 2011)
Topic C1. Slide 12 of 21 How to determine emissions from land-use/land-cover change Gain-loss method Stock difference method
Topic C1. Slide 13 of 21 Stock difference method (Ct2 Ct1 ) (t2 t1) C = C = annual carbon stock change in the pool Ct1 = carbon stock in the pool at time t1 Ct2 = carbon stock in the pool at time t2 C stock at time 1 C stock at time 2
Topic C1. Slide 14 of 21 Donato et al. 2012; Hughes et al. 2000; Kauffman et al. 2013; Pendleton et al. 2013; Kauffman et al. In press.
Topic C1. Slide 15 of 21 Gain-loss method C = CG CL C = annual carbon stock change in the pool CG = annual gain of carbon, tonnes CL = annual loss of carbon, tonnes C uptake via growth C stock Disturbance Harvest
Topic C1. Slide 16 of 21 Example of emissions from peat swamp forests and oil palm plantations Tanjung Puting National Park, Indonesia (Novita 2015) Peat net annual balance of GHG in the primary forest and oil palm plantations from tropical peatlands of Tanjung Puting Land-use system CO2 CH4 N2O GHG total 15.37 1. 1 14.53 0. 8 20.84 0.5 16.18 0.3 5.34 1.0 0.13 0.09 Forest 0.15 0.2 1.5 0.2 OP Contribution (%) of CO2, CH4 and N2O to total GHG emissions from primary forest and oil palm plantations in Tanjung Putting (from Novita PhD thesis 2015).
Topic C1. Slide 17 of 21 In addition to C stocks, there exists unique biodiversity values in tropical wetlands
Topic C1. Slide 18 of 21 Partial listing of co-benefits or ecosystem services that would be derived from forests managed under a REDD+ strategy ECOSYSTEM SERVICE/CO-BENEFIT Poverty alleviation Enhanced biodiversity Tropical storm protection (cyclones) Water quality Water quantity Timing of stream flow Fisheries habitat protection/enhancement FOREST TYPE All All Mangroves, marshes All Upland forest Upland forests All, particularly mangroves, riparian zones marshes All All All All Non-timber forest products Ecotourism Aesthetics Enhancement of resilience/ adaptation to climate change
Topic C1. Slide 19 of 21 Why are tropical forested wetlands attractive for REDD+ and other NAMAs? Conservation of biodiversity Coastal zone protection Fisheries Loss of livelihoods and culture Erosion Degradation of adjacent communities (sea grass and coral reefs) Carbon emissions/loss of C sinks Loss of other ecosystem services.
Topic C1. Slide 20 of 21 References Donato DC, Kauffman JB, Murdiyarso D, Kurnianto S, Stidham M, and Kanninen M. 2011. Mangroves among the most carbon-rich forests in the tropics. Nature Geosciences 4:293 297. doi: 10.1038/NGEO1123. Howard J, Hoyt, S, Isensee K, Telszewski M, Pidgeon E (eds.). 2014. Coastal Blue Carbon: Methods for assessing carbon stocks and emissions factors in mangroves, tidal salt marshes,and seagrasses. Arlington, Virginia, USA: Conservation International, Intergovernmental Oceanographic Commission of UNESCO, International Union for Conservation of Nature. [IPCC] Intergovernmental Panel on Climate Change. 2003. Good practice guidance for land use, land-use change, and forestry. Penman J, Gytarsky M, Hiraishi T, Krug Thelma, Kruger D, Pipatti R, Buendia L, Miwa K, Ngara T, Tanabe K, et al, eds. Japan: Institute for Global Environmental Strategies. Kauffman JB and Donato DC. 2012. Protocols for the Measurement, Monitoring, & Reporting of Structure, Biomass and Carbon Stocks in Mangrove Forests. Working Paper 86. Bogor: Center for International Forest Research. Kauffman JB, Heider C, Norfolk J, Payton F. 2014. Carbon Stocks of intact mangroves and carbon emissions arising from their conversion in the Dominican Republic. Ecological Applications 24:518 527. Pendleton L, Donato DC, Crooks S, Murray BC, Jenkins WJ, Sifleet S, Baldera A, Craft C, Fourqurean JW, Kauffman JB, et al. 2012. Estimating global blue carbon emissions from conversion and degradation of vegetated coastal ecosystems. PLoS ONE 7(9): e43542.doi:10.1371/journal.pone.0043542 [UNEP] United Nations Environment Programme. 2014. The Importance of Mangroves to People: A Call to Action. van Bochove J, Sullivan E, Nakamura T, eds. Cambridge: United Nations Environment Programme World Conservation Monitoring Centre, Cambridge.
Thank you The Sustainable Wetlands Adaptation and Mitigation Program (SWAMP) is a collaborative effort by CIFOR, the USDA Forest Service, and the Oregon State University with support from USAID. How to cite this file Kauffman JB and Murdiyarso D. 2015. Reducing emissions and enhancing removals [PowerPoint presentation]. In: SWAMP toolbox: Theme C section C1. Retrieved from <www.cifor.org/swamp-toolbox> Photo credit Boone Kauffman/Oregon State University, Daniel Murdiyarso/CIFOR, Nanang Sujana/CIFOR, Rupesh/CIFOR