Understanding Two-Stage Local Linear Least Squares Estimation
This presentation by Prof. Dr. Jos LT Blank delves into the application of two-stage local linear least squares estimation in Dutch secondary education. It discusses the pros and cons of stochastic frontier analysis (SFA) and data envelopment analysis (DEA), recent developments in local estimation techniques, and the benefits of non-linear local estimation in multiple stages. The method works on a weighted least squares basis, emphasizing observation weighting and efficiency proxy adjustments in iterative stages for model specification.

Download Presentation

Please find below an Image/Link to download the presentation.
The content on the website is provided AS IS for your information and personal use only. It may not be sold, licensed, or shared on other websites without obtaining consent from the author. Download presentation by click this link. If you encounter any issues during the download, it is possible that the publisher has removed the file from their server.
E N D
Presentation Transcript
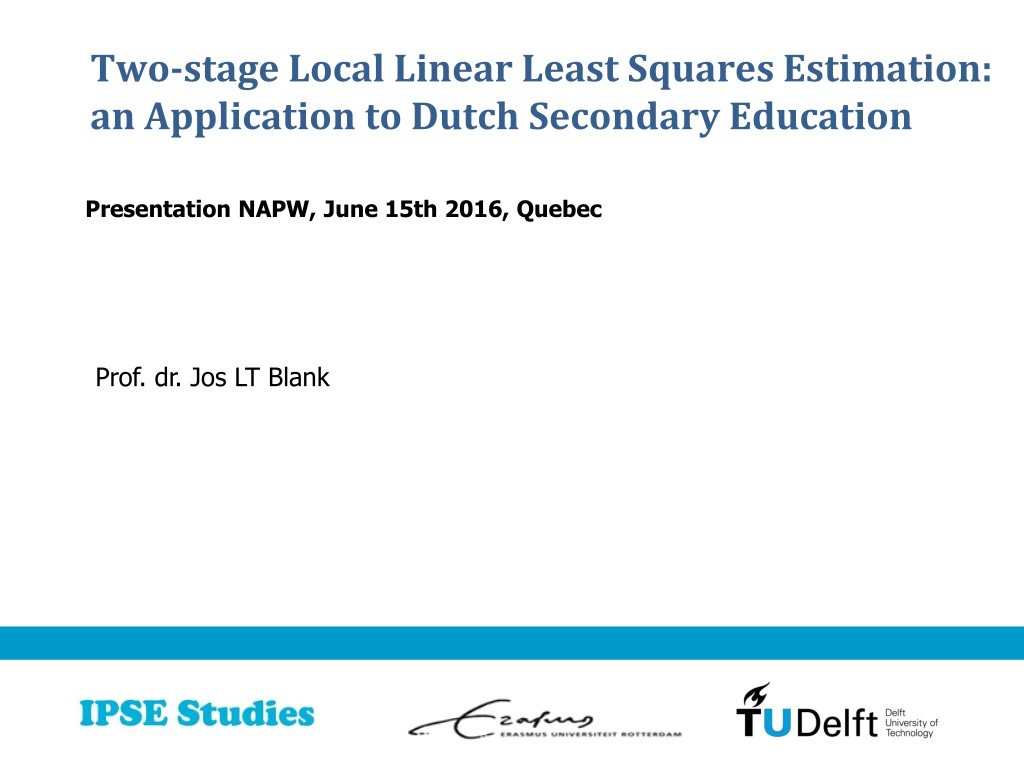
Two-stage Local Linear Least Squares Estimation: an Application to Dutch Secondary Education Presentation NAPW, June 15th 2016, Quebec Prof. dr. Jos LT Blank
Outline Pros and cons of: Stochastic Frontier Analysis (SFA); Data Envelopment Analysis (DEA); Recent developments: Stoned, Kernel Estimation (Local Estimation); Local Estimation The procedure; Application (secondary education).
The Pros of SFA and DEA SFA DEA Local estimator Transparent method (easy concept) Weak assumptions Stochastic method; Easy inclusion environmentals; Easy derivation economic char. (EOS, TC,..); Combine best of both worlds (STONED; Kernel and local estimators)
Non Linear Local Estimation (in multiple stages) Combines best of both worlds: Local technique; No a priori functional form (just 1storder Taylor approx.); Regression analysis; Stochastic component; Easy to control for environmental variables; Easy to derive scale effects, technical change etc.
How does it work? Observation by observation technique (cf DEA); Based on weighted least squares; Observations in Neighbourhood get a large weight; Distance to reference point determines the weight of an observation. To identify frontier apply 2ndand further stages: Use residual from 1st(or former) stage as a proxy for efficiency; Re-estimate the model by also including efficiency in the weight function;
Model specification ???ln(??) + 1???? ???ln ?? + ? ???ln(??) + ? ln ? = ?0+ ? 1. 2. ? ?= ?? (? = 1,..,?) With: ?? ?? ?? time ? ? ??,??,??, 1parameters to be estimated; = output m; = input price n; = environmental characteristic k; = trend; = cost share of input n;
Weights Iterative procedure k depends on N, cf bandwidth ???? ? ???? ???? ? = ??? ???? ???? ? = weight attached to an observation; k is a (fixed) parameter (comparable to bandwidth); ???? = sum of variances of ym; 2 ?(?? ?? = efficiency (from iterative procedure) )2; ?? = point of reference; ? ???? = Eff
Estimation ?0= ???? ? ln ???? ln ? ??= ???? ? ? ? ??? ? ? 1. For each observation i =1, .., I we apply (local) linear least squares. 2. After each linear least squares estimation, we set ????= exp( ( ?0? ???? ?)*(?0?>0)) (cf thick frontier); 3. eff will be used in next stage to set the variable weight.
Procedure summarized 1. Conducted in several stages ? = 1,..,?; (? = 1 eff = 1); stops at iteration S when eff 0.01. 2. At each stage: apply weighted LLS to each DMU separately (note: DMUs get different weights in each separate LLS due to varying dist); 3. Each separate LLS an estimate of the eff parameter; use in next stage to set the weight parameter (note that eff varies per stage and the dist parameter per observation). 4. At ? = ?: derive scale elasticity, marginal cost, technical change and cost efficiency scores.
Egg of Columbus? Unfortunately not: A priori weighting scheme (exponential, normal etc.); The distance measure; The role of parameter k; The efficiency parameter (TF) ; We can conduct sensitivity analysis (so far I did a few)
Secondary education: data and variables About 250 school boards 2007-2010 Three outputs: Number of pupils grades 1-2, corrected for pass rates; Number of pupils in vocational training, grades 3-4, corrected for pass rates; Number of pupils in general education, grades 3-6, corrected for pass rates. Five inputs: Management; Administrative personnel; Teaching personnel; Energy; Material supplies. Technology: Trend variable
Model and parameter estimates Model: Cost function model; 1st order Taylor approximation (in fact Cobb-Douglas function). Estimates: Convergence in three steps; Plausible and reliable estimates; Plausible economic results (see next slides).
Results: economies of scale by cost flexibility
Results: technical change Negative productivity change !!
Results: optimal allocation of teaching personnel and scale
Results: optimal input allocation and scale 4 other inputs
Sensitivity by varying k Set k = 1, 2 and 3; (Note: sd_tot = 1.17) Consquences for: Efficiency; Technical change; Cost flexibility.
Test (pairwise) differences Test mean difference Efficiency k=2 vs k=1 Efficiency k=3 vs k=1 Efficiency k=3 vs k=2 Technical change k=2 vs k=1 Technical change k=3 vs k=1 Technical change k=3 vs k=2 Cost flexibility k=2 vs k=1 Cost flexibility k=3 vs k=1 Cost flexibility k=3 vs k=2 Mean -0.002 -0.003 -0.001 -0.002 -0.002 -0.001 0.008 0.014 0.006 St. Error 0.005 0.005 0.000 0.000 0.000 0.000 0.002 0.002 0.000 T-test -0.375 -0.608 -3.777 -4.795 -6.681 -11.242 3.518 5.773 13.534 Differences are very small
Some conclusions and considerations Iterative LLS is an interesting alternative for SFA; It avoids questionable assumptions on functional form and on stochastic distributions (as well as computational problems); However, in return we need assumptions on weighting schemes; It produces plausible results, based on local technologies . Are we better off now? No convergence problems; More transparent method; Sensitivity analysis must give definite answer.
Further research Does this approach provide more robust results wrt assumptions on the weighting scheme compared to SFA wrt distributional assumptions? Does this approach provide more efficient estimates of scale economies, technical change etc. compared to SFA?


 differences")