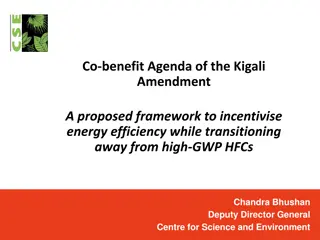
Policies and Programs for Improving Energy Efficiency in Cooling & Heat Pump Systems
Focus on energy efficiency policies and initiatives in the USA and North America for commercial buildings. Discusses the evolution of energy efficiency standards, multi-tiered approaches, and the regulatory environment, including historical improvements in commercial building regulations.

Download Presentation

Please find below an Image/Link to download the presentation.
The content on the website is provided AS IS for your information and personal use only. It may not be sold, licensed, or shared on other websites without obtaining consent from the author. Download presentation by click this link. If you encounter any issues during the download, it is possible that the publisher has removed the file from their server.
E N D
Presentation Transcript
Policy Programs for Improving Energy Efficiency in Existing Cooling and Heat Pump Systems Session VI, July 10, 2018 Richard Lord United Technologies Sr. Fellow ASHRAE Fellow ASHRAE 90.1 Vice Chair Richard.Lord@Carrier.utc.com
Introduction The focus of my comments are relative to policies and initiatives in the USA and North America with a focus on commercial buildings Overall the Energy Efficiency initiatives in the USA are very mature and have been in place since the 1970 s but continue to evolve, but for global products are becoming very complex and resource intensive. The approach and policies have matured and use a multi-tiered efficiency approach; 1. Minimum prescriptive efficiencies defined by US Department of Energy (DOE), ASHRAE 90.1, and IECC 2. Higher Tier Standards supported by, EnergyStar, CEE, Guidelines and Utility Rebates (3-4 levels) 3. Full Systems Approaches supported by new ASHRAE Appendix G, USGBC and Green Building Standards Historical approach of focusing on full load component based efficiencies is reaching the technical limits ( Max Tech ) and there are new initiatives begin to be considered and used; Annualized metrics (IPLV, GPLV, IEER, etc.) Sub-systems, and systems approaches Life cycle sustained approaches using continuous commissioning and diagnostics Some may think that the equipment efficiencies only applies to new products, but regulations and standards in the US apply in most cases to replacement and major renovations . 2
US Regulatory Environment (Standards and Guidelines) Most of these are support be test based certification program USA Efficiency Regulations Light Commercial (<65K, Single Phase) Commercial ( 65K, 3 Phase) Minimum Efficiency ASHRAE 90.1 Higher Tier Requirements Higher Tier Requirements Minimum Efficiency CEE Non Federal Requirements Federal Regulations NAECA/ESIA (DOE) Federal Regulations EPACT/ESIA (DOE) Non Federal Requirements EnergyStar (EPA) EnergyStar (EPA) DOE Standards and Test Procedures ASHRAE 90.1, 90.4 IECC State Codes (Title 20,24) City Codes ASHRAE 189.1, 2, 4 ASHRAE 90.1 Requirements CEE FEMP (DOE) IRC Standard AC Rooftops <760K WC Packaged <760K AC Cond Units <240K WSHP VRF <300K Motors Gas Furnace Fans ASHRAE 189.1/IGCC CALGREEN Large Packaged>760 All Chillers Large Condensing Units Fan Coils Air Handlers Export Products State Codes (i.e. Title 20) CALGREEN LEED LEED Whole Home ASHRAE Advanced Design Guide Requirements not federally preempted controlled and subject to change at the discretion of the author Federally Controlled Requirements Preempt state and local codes ASHRAE Building Labeling (BEQ) The higher tier marketing is about 20% of the market, but varies regional and is highly influenced by utility and state incentive/rebate programs EnergyStar Benchmark 3
Historical Regulatory Improvements Commercial Buildings ASHRAE 90.1 New Construction Commercial Efficiency Requirements 120% 90A-1980 90-75 90.1-2001 90.1-1989 90.1-1999 90.1-2004 100% 90.1-2007 Energy Use Index (1975 Use =100) Chart is based on data from the DOE/PNNL Progress Studies, ASHRAE 90.1 Strategic Plan, and ASHRAE BOD goals, and of ASHRAE 90.1 and Equipment Efficiency Historical Improvements 90.1-2010 80% 90.1-2013 90.1-2016 150 Ton AC Chiller 90.1-2019 Est 60% 10 Ton Rooftop 500 Ton WC Chiller Path B 40% Path B 90.1-2022 Est 90.1-2025Est 20% 90.1-2028? 90.1-2031(BOD Goal) Historical Whole Building Savings Future Target 0% 1970 1975 1980 1985 1990 1995 2000 2005 2010 2015 2020 2025 2030 2035 Year 4
Understanding Efficiency Metrics Hospital Zone 4a Large Office Zone 4a Industry historically focused on full load metrics at a common design conditions Commercial buildings spend most of their operating hours at part load and reduced ambient and new metrics like IPLV and IEER are more appropriate for equipment selection The world has different climate conditions and although standards mostly use one common design conditions local climatic conditions need to be considered (sensible and latent) Building Models from ASHRAE 90.1 Reference Buildings ASHRAE 169-2013 new climate zones Efficiency metrics are typical defined at a component level at standard rating conditions but do not always consider the full system and are not a good metric for system type selection Ductwork pressure drop and airflow controls Cooling tower approach and selection Hybrid systems (economizers, free cooling, energy recovery, evaporative cooling, ventilation air control, etc. Operational and Occupancy Controls Total of 19 zones with 9 thermal zones and 3 subzones for humidity ASHRAE has also defined benchmark cities for each of the climate zones 5
Improving Efficiency of Existing HVAC&R Systems Building Inspection/Energy Audit Complete a full inspection of the building and it s energy use. ASHRAE has a standard called ASHRAE 211-2011 that includes procedures for level 1, 2, and 3 audits. A 2018 update is in progress and should be released later this year. The audit data should be used to look at all the buildings energy use and not just the HVAC&R as plug load energy use. Also look closely at ventilation air requirements and operation. Climate zones will have an impact on where to focus (i.e. hot/cold, humid/dry) Review occupancy and building use and make sure it is still aligned with the original HVAC designs. Recommissioning In the US, as well as globally, we are beginning to see significant benefits by recommissioning the system, also using continuous commissioning and monitoring/diagnostics. (i.e. Seattle recently passed requirements for recommissioning every 5 years, Singapore has demonstrated significant savings, and green building standards are making monitoring of large system mandatory). Monitoring and connected equipment and buildings is opening many new opportunities for maintaining higher performance buildings. Controls Upgrades Implement improvements like proper time of day scheduling (timeclock), occupancy setpoint scheduling, ventilation control (demand ventilation). Also check that controls are functioning properly and have been commissioned and not in manual control mode. 6
Improving Efficiency of Existing Systems System Enhancements Partial upgrades to systems can help improve efficiency Use of variable speed fans/2 speed fans. For commercial system indoor fan power can be one of the largest loads due to continuous occupied operation for ventilation. Just a 66% speed of an indoor fan can reduce fan power by 70%. Be sure to coordinate with original equipment manufacturers to avoid reliability issues. Add economizers and or free cooling options. A recent survey conducted by AHRI indicated that only 42% of units are installed with free cooling and the number should be closer to 70 to 80% based on energy and economic studies Air Economizer Use outside air for cooling Hydronic/Fluid Use cooling tower on water cooled system for cooling Refrigerant Cycle Economizers cooling without the compressor at lower ambient Energy Recovery - For very hot and cold climates using higher levels of ventilation exhaust air energy recovery can reduce loads as well as in large buildings internal energy recovery can provide benefits for heating as well as domestic water. Evaporative Cooling In dry climates (B zones) evaporative cooling for condenser air and for ventilation air can add significant energy savings. Care should be to insure corrosion issues are not created with condenser coils and that there is proper water treatment 7
Improving Efficiency of Existing Systems At some point replacing equipment should be considered ASHRAE 90.1 New Construction Commercial Efficiency Requirements 120% 90A-1980 90-75 110% 90.1-2001 90.1-1989 90.1-1999 With the significant performance improvements due to regulations, equipment in the 10 year old range can have an acceptable payback, and there is the added benefit of a refrigerant change to lower GWP options. Note in most cases the new low GWP refrigerants are not a drop-in We sometimes see resistance to replacement due to US tax laws (depreciated life of 39 years), plus internal company capital limits (revised as of 2018 which allows first year expensing) There is some discussion of making HVAC part of the building asset value 90.1-2004 100% 90.1-2007 90% Energy Use Index (1975 Use =100) 90.1-2010 80% 90.1-2013 90.1-2016 70% 90.1-2019 Goal 60% 50% 40% 90.1-2022 Est 30% 90.1-2025Est 20% 90.1-2028? 90.1-2031(BOD Goal) 10% Future Target Historical Whole Building Savings 0% 1970 1975 1980 1985 1990 1995 2000 2005 2010 2015 2020 2025 2030 2035 Year In the US there are significant rebate programs that can often help with system upgrades especially for higher Tier efficiency requirements, but you have to know where to look and comply with the requirements. US Utilities see efficiency improvements easier to implement then new power plants HP/GPM Full Load & IPLV Pumping Power (2020) Water Cooled Chiller Cooling Tower Approach Pumping Power (2020) Piping Losses Cycles of Concentration HP/GPM When doing a unit upgrade the complete system should also be considered Cooling tower upgrades for water cooled systems Free cooling options, heat reclaim and hybrid systems Renewable energy interface including storage Look at plug loads Variable speed airflow and variable speed water flow Controls and monitoring Multiple unit sequencing Also consider load data (Energy Audits) and possible resizing of equipment Pumping Power (2020) Full Load & IPLV Piping Losses Water Cooled Chiller Cooling Tower Approach Pumping Power (2020) System Level Controls Pumping Power (2020) Cycles of Concentration Commissioning Diagnostics Energy Recovery Full Load Effectiveness Full Load Fan Efficiency Piping Losses Economizers/Ventilation Cabinet Leakage Duct Leakage Full Load Motor Efficiency Duct Losses Building Leakage Terminal Terminal Terminal Terminal Terminal Terminal Performance CO2 Setpoint Control Setpoint Demand Ventilation Component Requirements Defined Future Requirements 8 No requirements Annualized or part load metric
HVAC Cooling Energy Use for Commercial Office Building The following chart summarizes some of the energy cost analysis using tools being developed for compliance that can help guide system upgrades and retrofits Energy Cost includes chiller, cooling tower, chilled water pump, tower pump, indoor fan, exhaust fan and water cost Large Office Data Climate Zone Benchmark City Operating Hours Cooling Hours Airside Economizer Load Reduction Energy Recover Load Reduction Chiller Hours Air Cooled Water Cooled WC vc AC Chiller $126,693 $201,387 $105,543 $159,200 $120,894 $195,587 $103,417 $148,742 $93,271 $142,291 $75,295 $141,129 $61,333 $117,271 $60,112 $129,640 $40,105 $42,726 $40,102 $106,353 $19,750 $30,301 $29,225 $11,326 $28,211 $24,890 $22,696 $11,916 System % Chiller 62.9% 66.3% 61.8% 69.5% 65.5% 53.4% 52.3% 46.4% 40.4% 44.8% 37.7% 27.1% 35.5% 33.6% 15.8% 36.5% 27.1% 30.9% 16.7% Chiller $84,966 $203,021 $58,114 $159,729 $64,683 $183,848 $55,188 $145,725 $52,309 $136,967 $26,972 $137,148 $30,770 $114,409 $23,168 $126,919 $17,868 $103,416 $21,536 $14,263 $106,272 $7,122 $13,929 $9,568 $4,590 $13,646 $8,616 $10,488 $4,440 System % Chiller 41.9% 36.4% 35.2% 37.9% 38.2% 19.7% 26.9% 18.3% 17.3% 23.0% 13.4% 9.6% 16.5% 10.9% 6.3% 17.7% 9.5% 14.3% 6.1% 0a 0b 1a 1b 2a 2b 3a 3b 3c 4a 4b 4c 5a 5b 5c 6a 6b 7 8 Ho Chi Minh Dubai Honolulu New Delhi Tampa Tuscon Atlanta El Paso San Diego New York Albuquerque Seattle Buffalo Denver Port Angeles Rochester Great Falls International Falls Fairbanks 8760 8758 8760 8758 8759 8760 8725 8757 8760 8641 8746 8719 8602 8598 8677 8471 8590 8477 8223 8760 8758 8760 8758 7651 7020 5846 5843 6516 4316 4517 3329 3487 3590 2073 3277 2786 2748 1928 0.0% 0.0% 0.0% 0.0% 6.8% 14.1% 19.2% 21.5% 31.0% 27.4% 35.8% 57.1% 42.2% 41.3% 71.0% 39.0% 56.7% 49.1% 73.1% 16.3% 10.5% 7.1% 4.6% 5.7% 1.9% 4.4% 1.2% 0.3% 3.2% 0.3% 0.2% 1.2% 0.1% 0.0% 1.8% 0.1% 1.0% 0.0% -0.81% -0.33% 6.00% 2.03% 3.74% 2.82% 2.44% 2.10% -4.18% 1.71% 0.08% -1.79% 1.06% -0.90% -1.92% 0.34% 1.58% 0.08% -1.87% Analysis Assumption 400 Ton System Dual path B ASHRAE 90.1 Chillers Ventilation Air - 20-32% Electric Cost - $US 0.1063 $US /kW Water Cost - 5.64 $US/kW Sewage Cost - 6.33 $US/kW Water Treatment Cost - 0.81 $US/kW $99,265 $95,267 $93,637 $73,004 $85,303 $87,068 $71,543 $77,351 $91,900 $73,475 $71,168 $74,313 $84,398 $87,848 $72,917 $77,084 $90,445 $73,414 $72,501 Analysis based on ASHRAE 90.1-2016 compliant system using reference buildings and cities 9
Summary Considerable focus in US minimum equipment efficiencies which has created a very complex and resource intensive compliance and certification programs with multiple metrics and labeling requirements For existing buildings there are multiple approaches for improvement Energy Audits (ASHRAE 211) and review of system annual energy use Commissioning and Recommission Monitoring and Diagnostics System Upgrades Equipment Replacements and Upgrades (also upgrade refrigerants) Financial Justification Equipment upgrades require capital investment which typically require less than 4 year payback Rebates from Utilities and Governments can help with upgrades Consideration of new approaches (i.e. including HVAC&R in building asset) Building Labeling increase value Metrics (MEPs) Simple full load metrics are not the best approach Full modeling and building annualized analysis is the best, but less than 20% of buildings are modelled New simplified tools and approaches are needed and are being developed 10


")