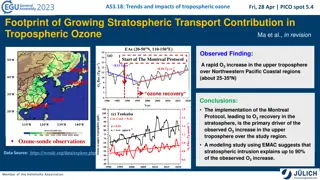
Simulation of Stratospheric Temperature by GFDL Models: Observations and Trends
Interannual variations of stratospheric temperature since 1979 are well simulated by GFDL models, showing general cooling trends, stronger cooling over Southern Hemisphere high latitudes, post-eruption warming, delayed cooling after eruptions, and flat trends in the 2000s. However, models tend to overestimate cooling over Southern Hemisphere high latitudes in the lower stratosphere.

Download Presentation

Please find below an Image/Link to download the presentation.
The content on the website is provided AS IS for your information and personal use only. It may not be sold, licensed, or shared on other websites without obtaining consent from the author. Download presentation by click this link. If you encounter any issues during the download, it is possible that the publisher has removed the file from their server.
E N D
Presentation Transcript
Stratospheric temperature simulated by GFDL models Pu Lin, Dan Schwarzkopf, and V. Ramaswamy NOAA/ GFDL, Princeton, NJ
Data Observations: MSU: RSS, UAH, NOAA SSU: NOAA, UKMO Models: CM3: full chemistry; model top at 0.01 hPa; 25 layers above 100 hPa. All forcing (AllForc) and Natural forcing only (Natural) each has 3 members. CM2.1: prescribe ozone; model top at 3 hPa; All forcing (AllForc), Natural forcing only (Natural) and Greenhouse gases + stratospheric ozone (WmGhgO3) each has 3 members
Global mean (90N-90S) MSU TLS anomalies Obs: RSS, UAH, NOAA TLS anomalies (K) CM3: AllForc (3 member mean) CM3: Natural (3 member mean) Year
Global mean (90N-90S) SSU anomalies Obs: NOAA (solid) UKMO (dashed) SSU-3 CM3: AllForc (3 member mean) SSU-2 CM3: Natural (3 member mean) SSU-1 Year Every tick is 0.5 K
Linear trends in MSU TLS (K/decade) 1979-2006 two years following major eruptions are excluded significant trends are marked by symbols Zonal mean Trend (K/decade) Obs: RSS, UAH, NOAA CM3: AllForc (3 member mean) CM3: Natural (3 member mean) Latitude
Linear trends in SSU (K/decade) 1979-2006 two years following major eruptions are excluded significant trends are marked by symbols SSU-3 Obs: RSS, UAH, NOAA CM3: AllForc (3 member mean) SSU-2 CM3: Natural (3 member mean) SSU-1 Latitude
Comparing CM3 vs CM2.1: zonal mean trends CM3 CM2.1 Latitude
Summary The interannual variations of stratospheric temperature since 1979 in general are well simulated by GFDL models: General cooling trends Stronger cooling over SH high latitudes Warming immediately following major eruptions Cooling a few years after major eruptions Flat trends during 2000s. In the lower stratosphere, models overestimate cooling over SH high latitudes (related to SH polar vortex and ozone hole), and underestimate cooling in subtropics (related to tropical expansion). In the mid/upper stratosphere, two observations show large difference in trends. CM3 agrees better with NOAA than with UKMO.
Summary (contd) Most of the trends are due to decrease of ozone and increase of GHGs. Natural forcing induces little trends. Model with internally generated ozone (CM3) simulates similar temperature trends to model with prescribed ozone (CM2.1).


 MSU TLS anomalies")
 SSU anomalies")
 1979-2006")
 1979-2006")
")


")