Understanding Independent Samples t-Test in Statistical Analysis
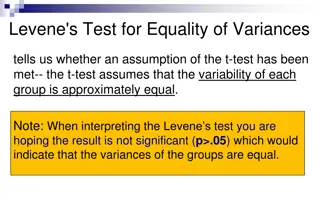
The independent samples t-test is used to compare means in a between-groups design where each participant is in only one condition. It involves sets of participant scores that are independent, meaning they are completely unrelated to each other. This test helps to determine if there is a significant difference between two groups' means in a study.
Download Presentation

Please find below an Image/Link to download the presentation.
The content on the website is provided AS IS for your information and personal use only. It may not be sold, licensed, or shared on other websites without obtaining consent from the author. Download presentation by click this link. If you encounter any issues during the download, it is possible that the publisher has removed the file from their server.
E N D
Presentation Transcript
The Independent- Samples t Test CHAPTER 11
Quick Test Reminder One person = z score One sample with population standard deviation = z test One sample no population standard deviation = single t-test One sample test twice = paired samples t-test
Independent Samples t-Test Used to compare two means in a between-groups design (i.e., each participant is in only one condition) Remember that dependent t (paired samples) is a repeated measures or within-groups design
Between groups design In between groups, your sets of participants scores (i.e. group 1 versus group 2) have to be independent Remember independence is the assumption that my scores are completely unrelated to your scores
Quick Distributions Reminder z = Distribution of scores z = distribution of means (for samples) t = distribution of means (for samples with estimated standard deviation) t = distribution of mean differences between paired scores (for paired samples with estimated standard deviation) t = distribution of differences between means (for two groups independent t)
Distribution of Differences Between Means
Hypothesis Tests & Distributions
Lets talk about Standard Deviation Test Standard Deviation Standard deviation of distribution of (standard error) (population) M Z Single t s (sample) sM Paired t s (sample on difference scores) sM Independent t s group 1 s group 2 spooled sdifference
Lets talk about Standard Deviation N -1 (X -M)2 Variance = same for all tests, but paired t is on difference scores s2= 2=s2 Standard error = same for paired and single t sM N
Lets talk about Standard Deviation N -1 (X -M)2 Variance = same for all tests, but paired t is on difference scores s2= df df = + 2 pooled 2 X 2 Y X Y s s s df df total total = + 2 difference 2 M 2 M s s s This section is for independent t only X Y
Lets talk about test statistics Test type Formula M M M M M sM M sM M M sdifference Z Single t Paired t Independent t
Additional Formulae ( ) ( ) M M = X Y X Y t s difference M M = X Y t s difference
Lets talk about df Test type df Single sample N 1 Paired samples t N 1 Independent t N 1 + N 1
Steps for Calculating Independent Sample t Tests Step 1: Identify the populations, distribution, and assumptions. Step 2: State the null and research hypotheses. Step 3: Determine the characteristics of the comparison distribution. Step 4: Determine critical values, or cutoffs. Step 5: Calculate the test statistic. Step 6: Make a decision.
Lets work some examples! Let s work some examples: chapter 11 docx on blackboard.
Assumptions Assumption Solution Normal distribution N 30 DV is scale Nothing do nonparametrics Random selection (sampling) Random assignment to group
Step 2 List the sample, population, and hypotheses Sample: group 1 versus group 2 Population: those groups mean difference will be 0 ( = 0)
Step 2 Now, we can list those as group 1 versus group 2 in our R and N Should also help us distinguish between independent t and dependent t R: group 1 =/ OR > OR < group 2 N: group 1 = OR <= OR >= group 2 Watch the order!
Step 3 List the descriptive statistics Group 1 Group 2 Mean SD N df Spooled Sdifference
Step 3 Get the mean summary(dataset) Get the sd sd(dataset$column, na.rm = T) Get N length(dataset$column)
Step 3 Get Spooled (evil!) spooled = sqrt( ((n1-1)*sd1^2 + (n2-1)*sd2^2) / (n1+n2 - 2))
Step 3 Get Sdifference (less evil) sdifference = sqrt((spooled^2/n1 + spooled^2/n2))
Step 4 Since we are dealing with two groups, we have two df but the t distribution only has one df? So add them together! df total = (n-1) + (n-1)
Step 4 Figure out the cut off score, tcritical Less test: qt(.05, df, lower.tail = T) Greater test: qt(.05, df, lower.tail = F) Difference test: qt(.05/2, df, lower.tail = T) May also be .01 remember to read the problem.
Step 5 Find tactual t.test(data$column, data$column, paired = F, var.equal = T, alternative = less OR greater OR two.sided , conf.level = .95 OR .99)
Step 5 Stop! Make sure your mean difference score, df, and hypothesis all match.
Step 6 Compare step 4 and 5 is your score more extreme? Reject the null Compare step 4 and 5 is your score closer to the middle? Fail to reject the null
Steps for Calculating CIs The suggestion for CI for independent t is to calculate the CI around the mean difference (MX MY). This calculation will tell you if you should reject the null remember you do NOT want it to include 0. Does not match what people normally do in research papers (which is calculate each M CI separately).
Confidence Interval Lower limit= Mdifference tcritical*SE Upper limit= Mdifference + tcritical*SE A quicker way! Use t.test() with a TWO tailed test to get the two tailed confidence interval. The r script effsize will give you each mean CI separately (how to interpret?).
Effect Size Used to supplement hypothesis testing Cohen s d: ( ) ( ) M M = X Y s X Y d pooled
Effect Size Remember, t(df) = t, p = p-value, d = d SE = standard error for each group, NOT Sdifference. Each CI here is calculated with df of the individual groups, not the total.


