Scaling BI Dashboards for Small to Medium-Sized Enterprises in the UK
Scaling BI dashboards is crucial for small to medium-sized enterprises (SMEs) in the UK to effectively manage their growing data needs. This blog delves into the unique challenges and best practices for implementing scalable Business Intelligence (BI) solutions.

Download Presentation
Please find below an Image/Link to download the presentation.
The content on the website is provided AS IS for your information and personal use only. It may not be sold, licensed, or shared on other websites without obtaining consent from the author. Download presentation by click this link. If you encounter any issues during the download, it is possible that the publisher has removed the file from their server.
Presentation Transcript
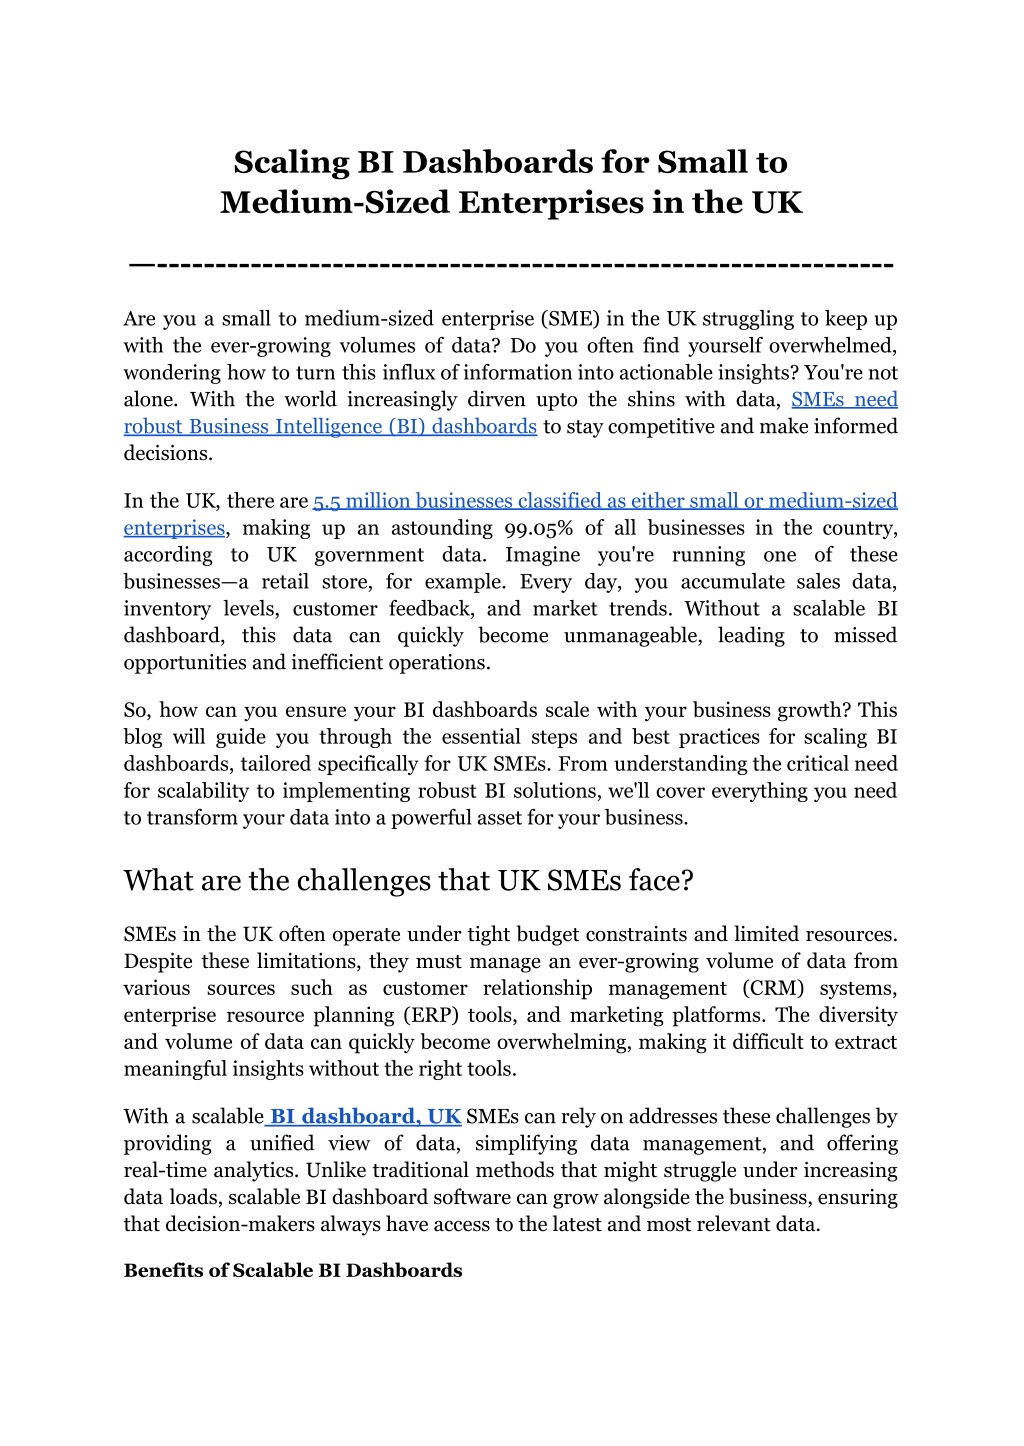
Scaling BI Dashboards for Small to Medium-Sized Enterprises in the UK --------------------------------------------------------------- Are you a small to medium-sized enterprise (SME) in the UK struggling to keep up with the ever-growing volumes of data? Do you often find yourself overwhelmed, wondering how to turn this influx of information into actionable insights? You're not alone. With the world increasingly dirven upto the shins with data, SMEs need robust Business Intelligence (BI) dashboards to stay competitive and make informed decisions. In the UK, there are 5.5 million businesses classified as either small or medium-sized enterprises, making up an astounding 99.05% of all businesses in the country, according to UK government data. Imagine you're running one of these businesses a retail store, for example. Every day, you accumulate sales data, inventory levels, customer feedback, and market trends. Without a scalable BI dashboard, this data can quickly become unmanageable, leading to missed opportunities and inefficient operations. So, how can you ensure your BI dashboards scale with your business growth? This blog will guide you through the essential steps and best practices for scaling BI dashboards, tailored specifically for UK SMEs. From understanding the critical need for scalability to implementing robust BI solutions, we'll cover everything you need to transform your data into a powerful asset for your business. What are the challenges that UK SMEs face? SMEs in the UK often operate under tight budget constraints and limited resources. Despite these limitations, they must manage an ever-growing volume of data from various sources such as customer relationship management (CRM) systems, enterprise resource planning (ERP) tools, and marketing platforms. The diversity and volume of data can quickly become overwhelming, making it difficult to extract meaningful insights without the right tools. With a scalable BI dashboard, UK SMEs can rely on addresses these challenges by providing a unified view of data, simplifying data management, and offering real-time analytics. Unlike traditional methods that might struggle under increasing data loads, scalable BI dashboard software can grow alongside the business, ensuring that decision-makers always have access to the latest and most relevant data. Benefits of Scalable BI Dashboards
Improved Decision-Making: A full-stack BI solution integrates data from various sources into a single, coherent view. This connection enables company leaders to make sound decisions based on extensive data analysis. For instance, a scalable BI dashboard can provide real-time insights into sales performance, customer behavior, and market trends, allowing UK SMEs to adjust strategies swiftly and effectively. Enhanced Operational Efficiency: Operational efficiency is critical for SMEs striving to maximize their output with limited resources. Scalable BI dashboard software streamlines data processing and reporting, reducing the time spent on manual data entry and analysis. This efficiency allows employees to focus on core business activities, driving productivity and growth. Better Customer Insights: Understanding customer needs and preferences is vital for any business. A BI dashboard in the UK context can offer deep insights into customer behavior, helping businesses tailor their products and services to meet market demands. This customer-centric approach can lead to increased satisfaction, loyalty, and ultimately, higher revenue. Key Considerations for Scaling BI Dashboards Scaling Business Intelligence (BI) dashboards is crucial for small to medium-sized enterprises (SMEs) in the UK to leverage their data effectively as they grow. To ensure that your BI dashboard UK businesses depend on remains efficient and effective, several key considerations must be addressed. These include data integration, user-friendly design, and maintaining performance and speed. Let's explore these aspects in detail. Data Integration Data integration is foundational to scaling BI dashboards. A full-stack BI solution integrates diverse data sources, providing a comprehensive view that supports informed decision-making. SMEs in the UK often use various tools for sales, marketing, finance, and operations. Integrating data from these sources into a single Business Intelligence dashboard is essential for several reasons: Unified View of Data: By consolidating data from CRM systems, ERP tools, and marketing platforms, a BI dashboard UK businesses use can provide a holistic view of the organization's performance. This unified view eliminates data silos, ensuring that all departments work with the same information. Real-Time Insights: Integrated data allows for real-time analytics, enabling businesses to respond swiftly to changing market conditions. For example, a retail SME can track inventory levels and sales trends in real-time, adjusting strategies to optimize stock and meet customer demand. Improved Accuracy: Data integration reduces the risk of errors that can occur when manually combining data from different sources. Automated 2
integration ensures data consistency and accuracy, which is critical for reliable analysis and reporting. User-Friendly Design A scalable BI dashboard must be user-friendly to ensure widespread adoption and effective use across the organization. The design should cater to various user roles, from executives to frontline employees. Here are some key elements of a user-friendly BI dashboard: Customizable Interfaces: Different users have different needs. Executives may require high-level summaries, while analysts need detailed data views. A customizable Business Intelligence dashboard allows users to tailor their interfaces to display the most relevant information. Intuitive Navigation: The BI dashboard software should have an intuitive layout that makes it easy for users to find the data they need. Clear menus, search functions, and logical grouping of information help users navigate the dashboard efficiently. Training and Support: To maximize the benefits of a BI dashboard UK companies should invest in comprehensive training and support for their employees. This ensures that all users, regardless of technical expertise, can leverage the full capabilities of the BI dashboard software. Performance and Speed As data volumes grow, maintaining the performance and speed of your BI dashboard is crucial. Slow or unresponsive dashboards can hinder decision-making and reduce user satisfaction. Here are some strategies to ensure high performance and speed: Scalable Infrastructure: Using cloud-based BI dashboard software provides the scalability needed to handle increasing data loads. Cloud solutions can dynamically allocate resources to maintain performance, ensuring that the dashboard remains responsive even during peak usage. Read 4 Ways SMBs Can Benefit from Cloud Computing Efficient Data Processing: Implementing efficient data processing techniques, such as in-memory analytics and data compression, can significantly improve the speed of data retrieval and analysis. This ensures that users can access real-time insights without delays. Regular Performance Monitoring: Continuous monitoring of the BI dashboard's performance helps identify and address potential bottlenecks before they impact users. Regular updates and optimizations ensure that the dashboard remains efficient as data volumes and complexity grow. Learn How To Use KPI Metrics To Measure Performance? 3
Best Practices for Implementing Scalable BI Dashboards Implementing scalable BI dashboards is essential for small to medium-sized enterprises (SMEs) in the UK to harness the full potential of their data. By following best practices, businesses can ensure their BI dashboards remain efficient, user-friendly, and capable of growing alongside their data needs. Here are the key practices for effectively implementing scalable BI dashboards: Starting Small and Scaling Gradually Pilot Projects: Begin with a pilot project to test the Business Intelligence dashboard in a controlled environment. This enables you to discover possible difficulties and make essential changes prior to a full-scale rollout. A pilot project can focus on a specific department or a limited set of metrics, providing valuable insights into the dashboard s functionality and user experience. Iterative Improvements: Scaling a BI dashboard UK SMEs rely on should be an iterative process. Start with essential features and gradually add more capabilities based on user feedback and evolving business needs. This approach ensures that the dashboard remains aligned with the organization's requirements and can adapt to changes efficiently. Involving Stakeholders: Engage key stakeholders from the outset to ensure the BI dashboard meets their needs. Regular feedback sessions and demonstrations can help refine the dashboard and secure buy-in from different departments, fostering a collaborative environment. Choosing the Right BI Tools Criteria for Selection: When selecting BI dashboard software, consider factors such as scalability, ease of integration, user-friendliness, and support. The software should be capable of handling increasing data volumes without compromising performance. Additionally, it should integrate seamlessly with your existing IT infrastructure and offer intuitive interfaces that cater to various user roles. Full-Stack BI Solutions: Opt for full-stack BI solutions that provide end-to-end capabilities, from data integration and processing to visualization and reporting. Full-stack BI solutions offer a cohesive environment, reducing the complexity of managing multiple tools and ensuring a smoother scaling process. Popular BI Tools: Evaluate popular BI tools that are well-suited for SMEs in the UK. Tools like Power BI, Tableau, and Grow offer robust scalability features and are known for their user-friendly interfaces and strong support communities. Choosing the right tool can significantly impact the success of your BI dashboard implementation. 4
Data Governance and Security Robust Data Governance Policies: Implementing robust data governance policies is crucial for maintaining data integrity and security as you scale your BI dashboard. Establish clear guidelines for data access, usage, and management to ensure consistency and compliance with UK data protection regulations, such as GDPR. Data Security Measures: Protecting sensitive data is key to everything. Ensure your BI dashboard software includes strong security features such as encryption, access controls, and regular security audits. This not only safeguards your data but also builds trust with stakeholders who rely on the integrity of your data insights. Regular Audits and Updates: Conduct regular audits to assess the effectiveness of your data governance and security measures. Stay updated with the latest security practices and implement necessary updates to address potential vulnerabilities, ensuring your Business Intelligence dashboard remains secure as it scales. Training and Support Comprehensive Training Programs: Provide comprehensive training programs to ensure all users can effectively utilize the BI dashboard. Tailor training sessions to different user roles, focusing on relevant features and functionalities. Well-trained users are more likely to adopt the dashboard and leverage its full potential. Ongoing Support: Offer ongoing support to address any issues or questions that arise as users interact with the BI dashboard. Regular check-ins, helpdesk services, and user forums can help maintain high user satisfaction and encourage continuous usage. User Feedback Loop: Establish a feedback loop to gather insights from users on their experiences with the BI dashboard. Use this feedback to make iterative improvements, ensuring the dashboard evolves to meet changing user needs and remains a valuable tool for the organization. Conclusion Scaling BI dashboards is an important step for small to medium-sized enterprises (SMEs) in the UK looking to leverage data for strategic growth. By understanding the unique challenges and implementing best practices, businesses can ensure their BI solutions grow alongside them, providing invaluable insights and fostering informed decision-making. From data integration and user-friendly design to maintaining performance and security, each aspect plays a crucial role in creating a scalable and effective Business Intelligence environment. In this journey towards scalable BI, choosing the right tool can make all the difference. Grow stands out as a comprehensive solution tailored for SMEs, offering 5
unparalleled integration capabilities, user flexibility, and a no-code, full-stack BI experience. With over 100 Grow integrations, including Google BigQuery, PostgreSQL, MySQL, HubSpot, Salesforce, QuickBooks, and Google Analytics, Grow ensures seamless data management across multiple sources. Moreover, Grow eliminates the hassle of per-seat charges by allowing unlimited users, fostering a collaborative data environment for your entire team. With its comprehensive business intelligence capabilities, this platform goes beyond just a simple tool by integrating ETL, data warehousing, visualization, and alarms. Whether you re an analyst needing powerful data processing or a business user looking for simplicity and self-service capabilities, Grow bridges the gap between complex data analysis and everyday business needs. Ready to experience the benefits of a scalable BI dashboard? Discover what sets Grow apart with a 14-day free demo. Don t just take our word for it check out the Grow.com Reviews & Ratings 2024 on TrustRadius to see how other businesses have transformed their data strategy with Grow. 6


![Key Stakeholder Issues on PDAL Bill [B8 2021] 24 October 2023](/thumb/88726/key-stakeholder-issues-on-pdal-bill-b8-2021-24-october-2023.jpg)