Analysis of BUSA's Position in Advance of the 2019 Medium-Term Budget Policy Statement
BUSA, as the voice of business in South Africa, presented its position ahead of the 2019 Medium-Term Budget Policy Statement to the NEDLAC Public Finance & Monetary Policy Chamber. The presentation highlighted challenges such as a weak macro-economic backdrop, budget deficits, and increasing debt-to-GDP ratios. Key concerns include the need for higher economic growth, increased tax collection, affordable expenditure, debt stabilization, restructuring of State-Owned Enterprises (SoEs), and managing the public sector wage bill. Fiscal pressures persist, with debt servicing costs rising rapidly and revenue falling short, leading to financial uncertainties.
Download Presentation
Please find below an Image/Link to download the presentation.
The content on the website is provided AS IS for your information and personal use only. It may not be sold, licensed, or shared on other websites without obtaining consent from the author. Download presentation by click this link. If you encounter any issues during the download, it is possible that the publisher has removed the file from their server.

Presentation Transcript
BUSA POSITION IN ADVANCE OF THE 2019 MEDIUM-TERM BUDGET POLICY STATEMENT: PRESENTATION TO THE NEDLAC PUBLIC FINANCE & MONETARY POLICY CHAMBER
BUSA Voice of Business in South Africa BUSA is a confederation of business organisations representing a cross- section of business, large and small CORPORATES UNISECTORAL CHAMBERS PROFESSIONALS All main sectors of the Economy Chambers of Commerce & Industry Professional Bodies Corporates Board of Trustees BUSA s function is to ensure business plays a constructive role in economic growth, development and transformation As the apex organisation of business in South Africa, BUSA conveys the views of its members in various structures, including NEDLAC 2
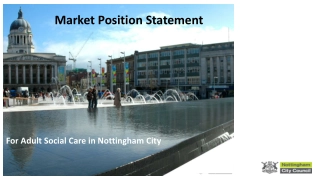
Weak macro-economic backdrop Budget deficit and increasing debt-to-GDP ratio approaching unsustainable levels 6 fundamental prescripts in the 2019 Budget aimed at placing the state finances on a sustainable basis, however there is continued deterioration in key fiscal metrics (i) Higher economic growth (ii) Increased tax collection (iii) Affordable expenditure (iv) Stabilising and reducing debt (v) Reconfiguring SoEs (vi) Managing public sector wage bill Persistently low economic growth is compounding this conundrum Debt to GDP (excluding SoE guarantees) Growing levels of debt Real GDP growth Weakening trend. SA well below peers Debt to GDP expected to peak at c. 60% in 2023/24 10% 60% 55% 16% higher than emerging market peers 8% South Africa 50% 6% 45% BRIC 40% 4.3% BRIC 3.3% MINT 4% 35% 2% 30% MINT 0.7% South Africa 25% 0% 20% 2010 2011 2012 2013 2014 2015 2016 2017 2018 2010 2011 2012 2013 2014 2015 2016 2017 2018 South Africa BRIC MINT South Africa BRIC MINT 3 BRIC: Brazil, Russia, India, China MINT: Mexico, Indonesia, Nigeria, Turkey
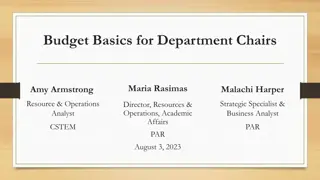
Fiscal pressures remain with debt service being the fastest growing expense Medium Term Budget Policy Statement 2018/19 Revenue outlook has deteriorated Shortfall 2019/20: R243bn 2020/21: R253bn 2021/22: R252bn Key drivers A Weak GDP Lower tax collection (2019/20: R1.47tn to R1.42tn) Compensation is a major driver of spending 2006/7: R170bn, 33% of total spend vs 2019/20: R628bn, 34% of total spend ? Expenditure remains inline with the Budget B Expenditure priorities Basic education (14% of total spend) Public health (12% of total spend) (2019/20: R1.8tn) Fastest rising expenditure: Debt servicing Increase by 14% from 2019/20 to 2021/22 Ave annual spend R131bn, 7% of budget R23bn allocated to Eskom and further guarantees for SOEs Denel: R1bn SAA: R6.2bn Key driver Insufficient profits to cover debt obligations SOEs a major risk to public finances C
Balance needed between revenue increases and expenditure reduction A Declines in tax buoyancy requires robust tax collection to balance the budget over the medium term o R15bn FY2018/19 revenue collection shortfall implies the 2019 budget deficit forecasts have been overshot, leading to credibility concerns among rating agencies The shortfall is partially a reflection of a long overdue institutional reform within SARS (including the re-establishment of the LBC and Illicit Economy Unit) Ongoing economic weakness, makes it even more critical for Government to focus on measures that improve tax compliance and administration o Business proposes regular reports from Treasury / SARS on efforts to stabilise SARS and the effect of fiscal interventions to do so Declining tax buoyancy and consistent revenue collection shortfalls, suggests there is little scope for tax increases in the short to medium term Fiscal consolidation dependent on generating greater efficiencies (e.g. effective tax collection), reducing expenditure and generating growth o Including the disposal of non-core assets and mothballing of under-performing programmes o Development of an investment-led growth strategy with aligned support across government needed: lack of detail in 2019 Budget Review.
Expenditure and Support for Growth B 2019/20 Budget Spending Programmes Total public spending over the MTEF period is expected to be R5.9tn Bulk of spending is allocated to learning and culture, social development, health and community development o Expenditure ceiling is increased by R16bn over the next three years c.R33bn have been reprioritised over the MTEF, mainly for service delivery and infrastructure Compensation of employees remains the largest category of spending Accounting for an average of 34.4% of consolidated expenditure over the MTEF period ~ measures are introduced to realise a R27bn reduction o Public sector wage increases in excess of CPI funded through higher taxes and not through any measurable increase in productivity (with corresponding economic benefits) o A full review of public sector human resource requirements, including incentive plans, is required to pave the way to an efficient, service orientated public sector o Development of an investment-led growth strategy with aligned support across government needed: lack of detail in 2019 Budget Review o 6
Infrastructure Requires a Viable Funding Plan SOEs will need to strike a balance between 3 sources of funding: revenue, debt and equity with the State as lender of last resort C Medium Term Expenditure Framework ( MTEF ) infrastructure (2020 to 2022) (Total of R865bn) South Africa s quality of infrastructure is ranked 67th out of 140 countries Eskom and Transnet account for c.R299bn or 88% of SOE capital spend through the MTEF 1000 PPPs National Departments 900 17 Administration Improving governance and administrative functions will have a disproportionately large positive impact on the economy Public entities Local 52 800 Health Government 67 Other economic services Other social services 700 Education 205 Provincial Government Human Settlements 600 Water & sanitation 500 Expected to total c.R158bn over the MTEF, accounting for c.18% of total public sector infrastructure spend. Eskom accounts for 85% of this spend 185 400 Energy SOEs 300 Expected to total c.R314bn over the MTEF, accounting for c.36% of total public sector infrastructure spend. Transnet accounts for 32% of this spend 200 339 Transport 100 - SOEs Provincial Government Local Government Public entities National departments PPPs 84% of total MTEF spend of R865bn 39% of total MTEF spend of R865bn allocated to infrastructure spend by SOEs
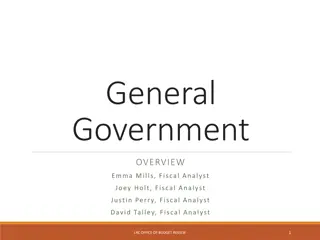
Performance of Key SoEs (2017/18) SoEs remain the biggest risk to sustainable public finances C SOEs1 average return on equity2 (%) vs long term bond yield None of the large SoEs are generating returns that cover Government s cost of capital 10% Yield of South African 10 year Government bond, 9.2% 7% 5% While recognising the developmental objective of SOEs, profitability improvements are required for SOEs to be sustainable and independent of Government funding / guarantees 3% 0% 0% -1% -5% As the top 10 SOEs (ranked by total assets) generate c.95% of total SOE EBITDA, priority should be given to improving the sustainability of these entities -25% -36% -10% Eskom Transnet SANRAL ACSA SAA PetroSA 739 370 388 32 16 17 Balance Sheet 389 123 50 9 16 1 Income Statement -0.7 3.8 -2.6 1.4 -3.5 -0.9 = R bn 2 year average NPAT = R bn gross asset value = R bn interest bearing debt Notes 1. SOEs selected based on asset size 2. ROE calculated as profit after tax divided by average last two years net income 3. For illustrative purposes, SAA s NAV excludes an accumulated loss of R32bn which would render the ROE calculation N/A given negative equity and losses Source 2017/18 SOEs annual report (most recent and publicly available)
Proposal Business remains committed to working with Government and Labour in promoting the principles set out in the 2019 Budget Continued deterioration in the debt-to-GDP ratio, exacerbated by persistent weak economic growth will lead, without intervention, to a debt crisis o In order to improve South Africa s growth trajectory, interventions need to be resourced and implemented immediately Reforms (either aimed at enhancing growth / revenue or reducing expenditure) have been difficult to implement and / or ineffectual An investment-led growth strategy, with the support of the private sector and implementable action plans, is an imperative o o Failure to achieve fiscal consolidation through internal reform is likely to result in an international bailout, with stringent conditionality Thereby reducing space for progressive fiscal interventions Business therefore proposes a discussion with the objective of understanding reforms required (before policy space narrows further) to avoid a possible bailout o o 9


")