Digital Agrifood Collective Commercial Viability Assessment Tool

Digital agrifood Collective

Commercial viability
assessment tool
Use this tool to assess the commercial viability
of the digital service providers you work with.


Farmers: Airtime
Agribusiness: Contracts with
farmers paying through input
purchase

Costs reductions:

New revenues:

5. Your profit & loss
What are your annual costs?
How much of these costs are covered
with revenues you generate?

3a. Your end user
Who uses your offering primarily?

Farmers and other individuals
SHFs, extension workers
Large value chain actors
Agribusinesses
Other


Commercial viability assessment tool

2. Your offering
Do you have something “sellable”?
And have you validated your target
group is happy with your offering?

1. Your team
Does your team have entrepreneurs
with the intention and capabilities to
sell on a commercial basis?

3b. Your paying customer
Who is willing to pay your bills and
what do you offer them in return?

4. Your revenue model
How do your customers pay you? For
your paying customers (in 3b), choose a
revenue model and add the price point.


6. Your potential to scale
What can you do to maximise your
revenues and reduce your costs? With
these strategies, what is the realistic
market size that you can obtain?


Cash out:

Cash in:

Difference:
$ -15k /year


Farmers (B2C)
SHFs, extension workers
Large value chain actors (B2B)
Agribusinesses, input retailers
Financial institutions
Other (B2G, B2NGO)
(Development grants)


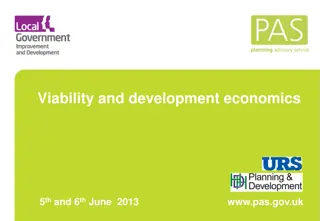
Example of a fictional company

% of income coming
from revenues:

Obtainable market size:
Weather forecasting and crop
advisory SMS service for
smallholder farmers. Farmers are
willing to pay if the service is
bundled, for instance with inputs.
Through their sales team, the
company establishes commercial
relationships with farmer touch
points such as agribusinesses,
insurance and input providers.
33
%
33
%
33
%
Staff: 30k
Office: 7k
Marketing: 9k
Data: 14k
= $ 60k /year
B2C revenues:
15k
B2B revenues:
15k
Grants: 15k
= $ 45k /year
67%
Reduce farmer
marketing
costs by
leveraging loyal
farmers.
Drive loyalty
and monthly
payments from
farmers.
3m SHFs
Costs reductions:
Examples:
Use of open data or
partner with NGOs.
New revenues:
Examples:
Advertising or add
new service offering
5. Your profit & loss
What are your annual costs?
How much of these costs are covered
with revenues you generate?
3a. Your end user
Who uses your offering primarily?
Farmers and other individuals
Large value chain actors
Other
Yes
Commercial viability assessment tool
2. Your offering
Do you have something “sellable”?
And have you validated your target
group is happy with your offering?
1. Your team
Does your team have entrepreneurs
with the intention and capabilities to
sell on a commercial basis?
3b. Your paying customer
Who is willing to pay your bills and
what do you offer them in return?
4. Your revenue model
How do your customers pay you? For
your paying customers (in 3b), choose a
revenue model and add the price point.
Examples:
For B2C, subscriptions at $2 per season
For B2B, advertising at $100 for 1,000 SMS
More examples in the Annex
Yes
6. Your potential to scale
What can you do to maximise your
revenues and reduce your costs? With
these strategies, what is the realistic
market size that you can obtain?
Cash out:
Examples:
Staff, geodata,
marketing, etc,
Cash in:
Examples:
Revenues, loan,
donations, etc.
Difference:
Farmers (B2C)
Large value chain actors (B2B)
Other (B2G, B2NGO)
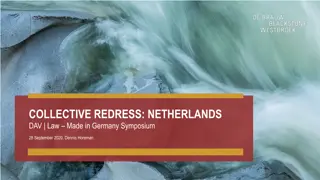
Blank Worksheet
% of income coming
from revenues:
Obtainable market size:
…
…
Commercial viability assessment tool
Annex: revenue models
Commercial viability assessment tool
Annex: cost reduction strategies
Assess the commercial viability of digital service providers in the agrifood sector using the Digital Agrifood Collective Commercial Viability Assessment Tool. This tool helps evaluate revenue models, profit & loss, team capabilities, offerings, target markets, and strategies for scaling. Utilize examples and a blank worksheet to understand how to apply the tool effectively.

Download Presentation

Please find below an Image/Link to download the presentation.
The content on the website is provided AS IS for your information and personal use only. It may not be sold, licensed, or shared on other websites without obtaining consent from the author.If you encounter any issues during the download, it is possible that the publisher has removed the file from their server.
You are allowed to download the files provided on this website for personal or commercial use, subject to the condition that they are used lawfully. All files are the property of their respective owners.
The content on the website is provided AS IS for your information and personal use only. It may not be sold, licensed, or shared on other websites without obtaining consent from the author.
E N D
Presentation Transcript
Digital agrifood Collective Commercial viability assessment tool Use this tool to assess the commercial viability of the digital service providers you work with.
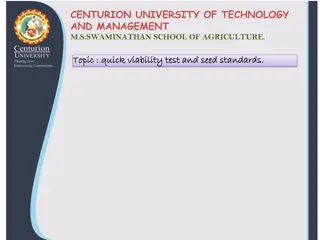
Commercial viability assessment tool Example of a fictional company Through their sales team, the company establishes commercial relationships with farmer touch points such as agribusinesses, insurance and input providers. 4. Your revenue model 4. Your revenue model How do your customers pay you? For your paying customers (in 3b), choose a revenue model and add the price point. 5. Your profit & loss 5. Your profit & loss What are your annual costs? How much of these costs are covered with revenues you generate? 1. Your team 1. Your team Does your team have entrepreneurs with the intention and capabilities to sell on a commercial basis? Farmers: Airtime Cash out: Cash in: Staff: 30k Office: 7k Marketing: 9k Data: 14k B2C revenues: 15k B2B revenues: 15k Grants: 15k = $ 45k /year Agribusiness: Contracts with farmers paying through input purchase Weather forecasting and crop advisory SMS service for smallholder farmers. Farmers are willing to pay if the service is bundled, for instance with inputs. 2. Your offering 2. Your offering Do you have something sellable ? And have you validated your target group is happy with your offering? = $ 60k /year Difference: $ -15k /year 3a. Your end user 3a. Your end user Who uses your offering primarily? 3b. Your paying customer 3b. Your paying customer Who is willing to pay your bills and what do you offer them in return? 67% % of income coming from revenues: 6. Your potential to scale 6. Your potential to scale What can you do to maximise your revenues and reduce your costs? With these strategies, what is the realistic market size that you can obtain? Costs reductions: New revenues: Farmers and other individuals SHFs, extension workers Farmers (B2C) SHFs, extension workers 33 % Reduce farmer marketing costs by leveraging loyal farmers. Drive loyalty and monthly payments from farmers. Large value chain actors (B2B) Agribusinesses, input retailers Financial institutions Large value chain actors Agribusinesses 33 % Other Other (B2G, B2NGO) (Development grants) 33 % 3m SHFs Obtainable market size:
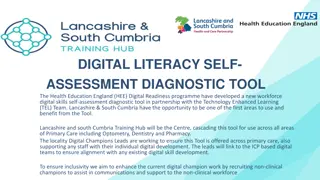
Commercial viability assessment tool Blank Worksheet 4. Your revenue model 4. Your revenue model How do your customers pay you? For your paying customers (in 3b), choose a revenue model and add the price point. 5. Your profit & loss 5. Your profit & loss What are your annual costs? How much of these costs are covered with revenues you generate? 1. Your team 1. Your team Does your team have entrepreneurs with the intention and capabilities to sell on a commercial basis? Cash out: Cash in: Yes 2. Your offering 2. Your offering Do you have something sellable ? And have you validated your target group is happy with your offering? Examples: For B2C, subscriptions at $2 per season For B2B, advertising at $100 for 1,000 SMS More examples in the Annex Examples: Staff, geodata, marketing, etc, Examples: Revenues, loan, donations, etc. Yes Difference: 3a. Your end user 3a. Your end user Who uses your offering primarily? 3b. Your paying customer 3b. Your paying customer Who is willing to pay your bills and what do you offer them in return? % of income coming from revenues: 6. Your potential to scale 6. Your potential to scale What can you do to maximise your revenues and reduce your costs? With these strategies, what is the realistic market size that you can obtain? Costs reductions: New revenues: Farmers and other individuals Farmers (B2C) Large value chain actors (B2B) Large value chain actors Examples: Use of open data or partner with NGOs. Examples: Advertising or add new service offering Other Other (B2G, B2NGO) Obtainable market size:
Commercial viability assessment tool Annex: revenue models Revenue model Explanation Example Advantages Pay-per-use (B2C) Farmer advisory SMS. Mobile money transactions. Lowers the perceived entry barrier for customer to try out new solutions for as much/long as they want. Customers pay on the basis of what they effectively use. SaaS providers for eg. ERP software. Weather forecast subscriptions. While customers benefit from lower usage costs (in the long run) and guaranteed service availability, the company generates a predictable and steady income stream. Subscriptions (B2C, B2B) Customers pay a regular fee, usually on a monthly or annual basis, to gain access to a product or service. A free offering attracts large volume of customers that want to try-before-they-buy . Although a smaller subset, premium customers can generate sufficient revenue. Freemium model (B2C) Customers enjoy a basic version of of the offering for free. Once persuaded by the benefits, customers to pay for the premium version. Social media like Linkedin. Can be a lucrative additional revenue stream when large volumes of data are collected anyhow. Data analytics and AI can generate unique insights that can be extremely valuable for large agrifood value chain actors. Data monetisation (B2B) Stakeholders such as governments, large companies and financial institutions pay for the aggregated data collected about the users of the service. Food production forecasts. Farmer credit worthiness. Targeted marketing. Customers pay indirectly through other transactions such as: data they provide, a deduction from their income, their payments for loans/insurance/mobile money. Indirect payments (B2B) Input sales bundled with SMS advisory. Provides opportunities to collaborate with other actors in the value chain. Lowers the barrier for users/customers to engage, while the service provider benefits from large brands paying for advertisements. Finding a few paying advertisers can be easier than finding a lot of paying farmers. End-users do not pay as the main source of revenue comes from a third party customer that is interested in advertising to your customers/user base. Social media like Facebook. Input adverts in farmer advisory SMS messaging. Advertising (B2B) The licensor (firm that develops/sells the technology/service) transfers know-how and assets to the licensee (firm wanting to the the same technology/service) that pays a license fee. Creates opportunities for faster and more widespread introduction of a service, particularly when licensing to customers with large networks of farmers/customers. Licensing (B2B) New seed varieties.
Commercial viability assessment tool Annex: cost reduction strategies Cost minimisation strategies for digital service providers Explanation Collaborating with other parties to share costs of eg. marketing and farmer training. These can be NGOs or GOs that share similar goals of empowering smallholders. Collaboration Optimizing the number of FTEs in the core team and/or working with team members or freelancers (such as developers) in countries where salaries are lower. Smaller teams Open data Using open datasets (eg. Sentinel satellite data) instead of paying for data. Low-cost procurement Replacing existing service providers by more affordable ones. Scaling the service to more farmers or other users, either individually or through licensing of the service to organisation in countries where the service provider is not active yet. Economies of scale