Understanding Linear Inequalities in Two Variables
Explore the concept of linear inequalities in two variables through graphing and modeling real-world situations. Learn how to identify solutions, graph inequalities, and determine shading direction. Practice problems and visual examples enhance understanding of these mathematical concepts.

Download Presentation

Please find below an Image/Link to download the presentation.
The content on the website is provided AS IS for your information and personal use only. It may not be sold, licensed, or shared on other websites without obtaining consent from the author. Download presentation by click this link. If you encounter any issues during the download, it is possible that the publisher has removed the file from their server.
E N D
Presentation Transcript
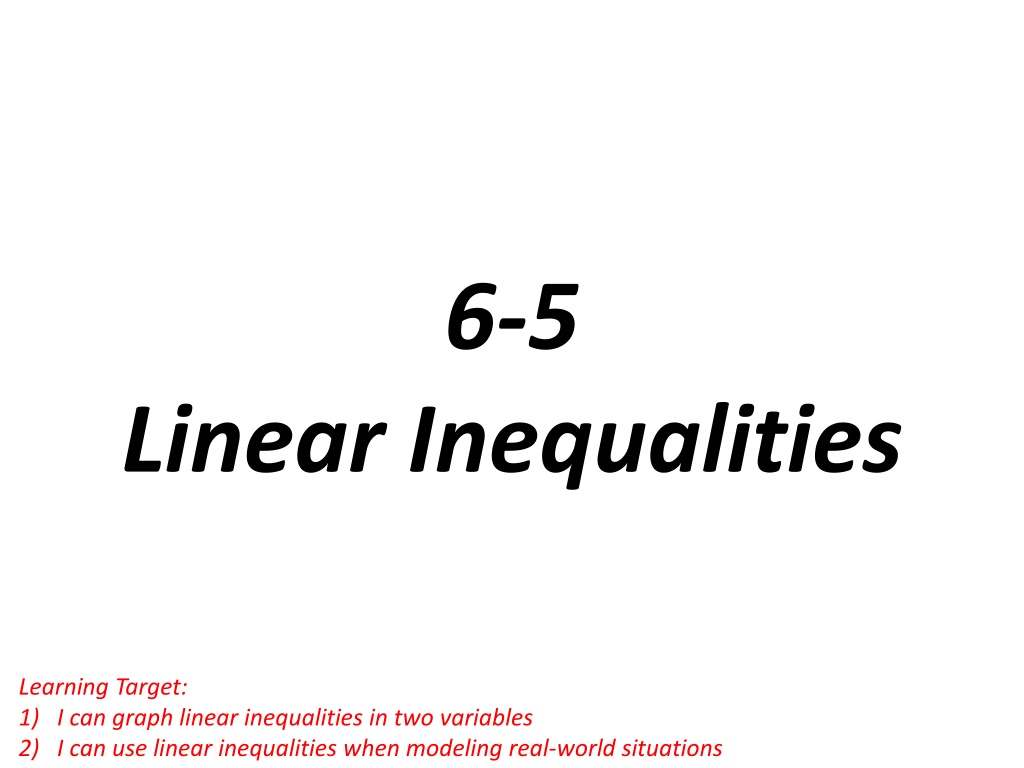
6-5 Linear Inequalities Learning Target: 1) I can graph linear inequalities in two variables 2) I can use linear inequalities when modeling real-world situations
Linear Inequality: in two variables, such as ? > ? 3can be formed by replacing the equal sign in a linear equation with an inequality symbol Solution of an inequality: in two variable is an ordered pair that makes the inequality true.
Problem 1: Identifying Solutions of a Linear Inequality Is the ordered pair a solution of ? > ? 3 (1,2)
What you need to know: Type of Lined needed: < or > Dashed line ?? Solid Line Where to Shade: ? > or y Shade Above ? < or y Shade Below
Problem 2: Graphing an Inequality in Two Variables What is the graph of ? > ? 2
What is the graph of ? 1 2? + 1
Problem 3: Graphing a Linear Inequality in One Variable What is the graph of ? > 1
Problem 4: Rewriting to Graph an Inequality An interior decorator is going to remodel a kitchen. The wall above the stove and the counter is going to be redone as shown. The owners can spend $420 or less. Write a linear inequality and graph the solutions. What are 3 possible prices for the wallpaper and tiles?
For a party, you can spend no more than $12 on nuts. Peanuts cost $2/lb. Cashews cost $4/lb. What are three possible combinations of peanuts and cashews you can buy?
Problem 5: Writing an Inequality From a Graph What is the inequality that represents the graph?


 a solution of ? > ? − 3?")