Estimating Bicycle and Pedestrian Demand Using Accessibility Approach
Research conducted by NCHRP 08-78 focuses on estimating bicycle and pedestrian demand through innovative methods sensitive to land use and facilities. The study highlights the importance of accessibility in influencing travel behavior and mode choice, emphasizing the need to account for impedance unique to each mode. Detailed travel networks are utilized to model travel times across different modes, such as walking, biking, transit, and driving. The research aims to create scalable techniques for estimating demand and enhancing transportation planning strategies.

Download Presentation

Please find below an Image/Link to download the presentation.
The content on the website is provided AS IS for your information and personal use only. It may not be sold, licensed, or shared on other websites without obtaining consent from the author. Download presentation by click this link. If you encounter any issues during the download, it is possible that the publisher has removed the file from their server.
E N D
Presentation Transcript
NCHRP 08-78 Renaissance Planning Group Rich Kuzmyak Chris Sinclair Alex Bell TRB National Transportation Planning Applications Conference May 6, 2013 Columbus, Ohio
Research context Basics of the accessibility approach Summary of research findings Application Next steps
NCHRP 8-78: Estimating Bicycle and Pedestrian Demand Create new methods sensitive to land use and facilities Product: Practitioner Guidebook of scalable techniques Tour-based models (Seattle Bradley & Bowman) Enhanced 4-step (Seattle Kockelman & Kahn) Accessibility approach (Arlington VA)
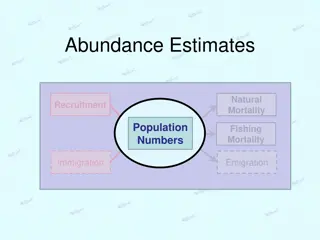
Travel behavior is responsive to accessibility Mode choice can be linked to: Amount of activity reachable from an origin over corresponding modal network Account for impedance unique to mode (directness, slope, facility type, etc.)
Use detailed travel networks to model travel times from a given origin to all accessible destinations (by mode): Walk Bike Transit Auto NAVTEQ streets, GTFS transit schedules, bicycle facilities and trails
SAMP 2191645 Walkable - Ballston HH AT LINK 18422512 Impedance Rings 5 Minutes Cumulative 10 Minutes Cumulative 15 Minutes Cumulative 20 Minutes Cumulative 25 Minutes Cumulative 30 Minutes Cumulative Walk Bike Auto Total Grocery Locations Total Grocery Locations Total Grocery Locations Employment Employment Employment 50 50 0 0 4 4 9 24,114 24,114 10,164 34,278 13,654 47,932 29,089 77,021 41,228 118,249 23,373 141,622 10 10 16 26 23 49 71 120 45 165 32 197 59,388 59,388 268,845 328,233 634,064 962,297 310,038 1,272,335 349,918 1,622,253 431,120 2,053,373 85 85 253 338 481 819 454 1,273 555 1,828 587 2,415 5,526 5,576 21,276 26,852 3,827 30,679 2,202 32,881 2,701 35,582 13 10 23 2 25 4 29 SAMP 2267554 Non-Walkable HH AT LINK 113364195 Impedance Rings 5 Minutes Cumulative 10 Minutes Cumulative 15 Minutes Cumulative 20 Minutes Cumulative 25 Minutes Cumulative 30 Minutes Cumulative Walk Bike Auto Total Grocery Locations Total Grocery Locations Total Grocery Locations Employment Employment Employment 9 9 0 0 0 0 0 0 1 1 0 1 0 1 71 71 73 144 324 468 1,619 2,087 1,089 3,176 4,216 7,392 0 0 1 1 3 4 1 5 1 6 3 9 4,515 4,515 37,662 42,177 27,288 69,465 17,618 87,083 102,806 189,889 118,282 308,171 6 6 57 66 59 65 49 114 51 165 113 278 169 447 5 71 15 86 26 112 222 334
Total Employment - Walksheds Total Employment - Bikesheds 40,000 160,000 35,000 140,000 30,000 120,000 25,000 100,000 Ballston Ballston 20,000 80,000 Suburbs Suburbs 15,000 60,000 10,000 40,000 5,000 20,000 0 0 0 10 20 30 40 0 10 20 30 40 Total Employment - Drivesheds 2,500,000 2,000,000 1,500,000 Ballston Suburbs 1,000,000 500,000 0 0 10 20 30 40
Non-motorized trip making is associated with high accessibility scores, regardless of mode Modal competiveness (in terms of accessibility) influences mode choice More transit trips are made to destinations that have high walk and transit accessibility scores Discretionary walk trips are highly sensitive to walk accessibility at the trip origin Walk to work a unique/limited opportunity
Number of Establishments Accessible from Origin Auto 1367 1195 1177 1345 1506 Transit 129 69 66 124 120 Walk 109 60 57 98 91 Bike 1162 868 840 998 1191 Chosen Mode Transit Drive Alone Auto Pax Walk Bicycle Number of Employees Accessible from Origin Auto 18110 15092 13658 23583 19516 Transit 1650 984 840 2962 1470 Walk 1457 797 673 2329 1237 Bike 13986 10783 9254 15778 14845 Chosen Mode Transit Drive Alone Auto Pax Walk Bicycle
Walk accessibility alone influences mode choice Auto Transit 100% 100% Auto Log. (Auto) Transit 80% 80% Log. (Transit) 60% 60% 40% 40% 20% 20% 0% 0% >200 200 400 600 800 1000 1200+ >200 200 400 600 800 1000 1200+ Bike Walk 5% 50% Walk Bike 4% 40% Log. (Walk) Log. (Bike) 3% 30% 2% 20% 1% 10% 0% 0% >200 200 400 600 800 1000 1200+ >200 200 400 600 800 1000 1200+
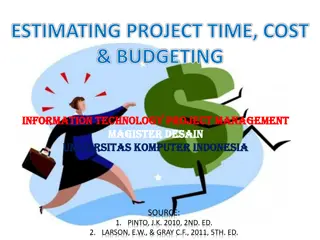
GIS Identify Study Area (parcels/blocks/TAZs) SELECTION TOOL WALK NETWORK & SKIMS Identify Walkshed (area within 30 min walk) Compile SEDs for Walkshed DUs: SF and MF EMP: IND, COM, SVC TRIP GENERATION RATES Person Trip Generation Productions & Attractions for HBW, HBO, NHB Walk Score Calculation For each parcel as an origin and destination WALK SCORE MODE SPLIT CURVES Walk Trip Generation Convert person trip P s & A s to Walk P s & A s Walk Trip Tables Balance Walk P s & A s for Walkshed by Purpose USER DASHBOARD (summary of inputs and outputs comparing scenarios)
Spreadsheet tool (beta version and template for additional tools)
Models effects of Land use changes Development master plans Disaggregated TAZ forecasts Future land use scenarios Network enhancements Accessibility benefits of improving street connectivity Non-motorized facilities
Data and process Microzone residential and employment activity Person trip generation Zone to zone walk skims (microzones) Walk accessibility score Output Microzone walk trip generation Matrix of walk microzone to microzone walk trip interchange
Develop native GIS tool Community Viz or other scenario planning platform Enable dynamic spatial analysis Evaluate and operationalize relationships among modal accessibilities and socio- demographics High local walk access, low regional transit access vs. High local walk access, high regional transit access Household and individual characteristics
Incorporate into NCHRP Guidebook Integrate with regional travel demand model Incorporate EPA s Smart Location Database modal accessibilities and add geoprocessing services to support rapid deployment of the tool