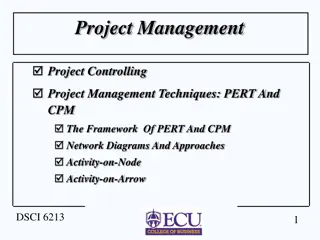
Understanding Project Management Terminology and Techniques

Explore the key concepts and methods in project management, such as expert judgment, analogous estimating, three-point estimates, and critical path analysis. Learn about hidden time factors, activity types, terminology paths, and network flow principles. Gain insights into historical development, including the late 1950s Program Evaluation and Review Technique (PERT) and Critical Path Method (CPM). Enhance your understanding of project planning and execution through visual aids and expert quotes.

Download Presentation

Please find below an Image/Link to download the presentation.
The content on the website is provided AS IS for your information and personal use only. It may not be sold, licensed, or shared on other websites without obtaining consent from the author. Download presentation by click this link. If you encounter any issues during the download, it is possible that the publisher has removed the file from their server.
E N D
Presentation Transcript
I have no idea how long it will take. I do not even know what I am being asked To do. So what do I say? I ll take my best guess and double it!
Expert judgment Analogous estimating Parametric estimating Three-point estimates Reserve analysis 1. 2. 3. 4. 5.
Average Most likely Pessimistic Optimistic
Hidden Time 1. Procrastination 2. Demands 3. On Schedule 4.
I keep six honest serving-men (they taught me all I knew); their names are What and Why and How and Where and Who. Rudyard Kipling
Late 1950s Program Evaluation and Review Technique (PERT) U.S. Navy, Booz-Allen Hamilton, and Lockeheed Aircraft Probabilistic activity durations Critical Path Method (CPM) Dupont De Nemours Inc. Deterministic activity durations
Terminology Activity: project that requires time. Merge activity: that has two or more preceding activities on which it depends. Parallel (concurrent) activities: occur independently and, if desired, not at the same time. Activity: an element of the A A Merge activity: an activity B B D D Parallel (concurrent) activities: Activities that can C C
Terminology Path: activities. Critical path: the activity network that allows for the completion of all project-related activities; the shortest expected time in which the entire project can be completed. (Delays on the critical path will delay completion of the entire project). Path: a sequence of connected, dependent Critical path: the longest time pathway through C C D D A A B B
Networks typically flow from left to right. An activity cannot begin until all of its activities are complete. Arrows indicate precedence and flow and can cross over each other. Identify each activity with a unique number; this number must be greater than its predecessors. Looping is not allowed. Conditional statements are not allowed. Use common start and stop nodes.
TABLE 6.1 TABLE 6.1
FIGURE 6.3 FIGURE 6.3
FIGURE 6.4 FIGURE 6.4
TABLE 6.2 TABLE 6.2
Forward PassEarliest Times How soon can the activity start? (early start ES) How soon can the activity finish? (early finish EF) How soon can the project finish? (expected time ET) Backward Pass Latest Times How late can the activity start? (late start LS) How late can the activity finish? (late finish LF) Which activities represent the critical path? How long can it be delayed? (slack or float SL)
FIGURE 6.5 FIGURE 6.5
Add activity times along each path in the network (ES + Duration = EF). Carry the early finish (EF) to the next activity where it becomes its early start (ES) unless The next succeeding activity is a merge activity, in which case the largest EF of all preceding activities is selected. unless
FIGURE 6.6 FIGURE 6.6
Subtract activity times along each path in the network (LF - Duration = LS). Carry the late start (LS) to the next activity where it becomes its late finish (LF) unless... The next succeeding activity is a burst activity, in which case the smallest LF of all preceding activities is selected. unless...
Free Slack (or Float) The amount of time an activity can be delayed without delaying connected successor activities Total Slack The amount of time an activity can be delayed without delaying the entire project The critical path is the network path(s) that has (have) the least slack in common.
FIGURE 6.8 FIGURE 6.8
The likelihood the original critical path(s) will change once the project is initiated. Function of: The number of critical paths The amount of slack across near critical activities Function of: The number of critical paths The amount of slack across near critical activities
Laddering Activities are broken into segments so the following activity can begin sooner and not delay the work. Lags The minimum amount of time a dependent activity must be delayed to begin or end Lengthy activities are broken down to reduce the delay in the start of successor activities. Lags can be used to constrain finish-to-start, start- to-start, finish-to-finish, start-to-finish, or combination relationships.
FIGURE 6.12 FIGURE 6.12
Use of Lags to Reduce Detail Use of Lags to Reduce Detail
Finish-to-start linkage Start-to-start linkage
Finish-to-finish linkage Start-to-finish linkage
Because the Gantt Chart is such a traditional tool and appears so simple on the surface, it doesn t always get the respect it deserves as a project management tool. Here are some of the uses of a Gantt Chart. Management reports. The simplicity and visual strength of a Gantt Chart makes it the ideal tool to use when you re reporting to someone who doesn t know project management. Testing the Time constraint. When you re doing preliminary project planning and have numerous parallel tasks, you often don t know how long the project will take in calendar time. The Gantt Chart will show you. Allocating resources. The Gantt Chart helps you to allocate and track resources and identify conflicts.
What and determine which one(s) are best for your project. What- -If analysis. If analysis. You can explore many options visually Resource management. both in controlling resources on a single project and in managing resources across projects in a multiple project environment. Resource management. The Resource Gantt Chart works Tracking progress. allows you to compare actual project performance to plan, shows you the consequence of tasks not finishing on their assigned times, and gives you a tool to explore options. Tracking progress. The Tracking Gantt Chart, which


")

 will")