South Carolina Public Service Authority Revenue Obligations Investor Presentation
This investor presentation provides details on South Carolina Public Service Authority Revenue Obligations for 2024, including Tax-Exempt Improvement Series A, Tax-Exempt Refunding Series B, and Taxable Improvement Series C. It emphasizes the preliminary nature of the information and the need for careful consideration before making any investment decisions related to the Bonds.
Download Presentation

Please find below an Image/Link to download the presentation.
The content on the website is provided AS IS for your information and personal use only. It may not be sold, licensed, or shared on other websites without obtaining consent from the author. Download presentation by click this link. If you encounter any issues during the download, it is possible that the publisher has removed the file from their server.
E N D
Presentation Transcript
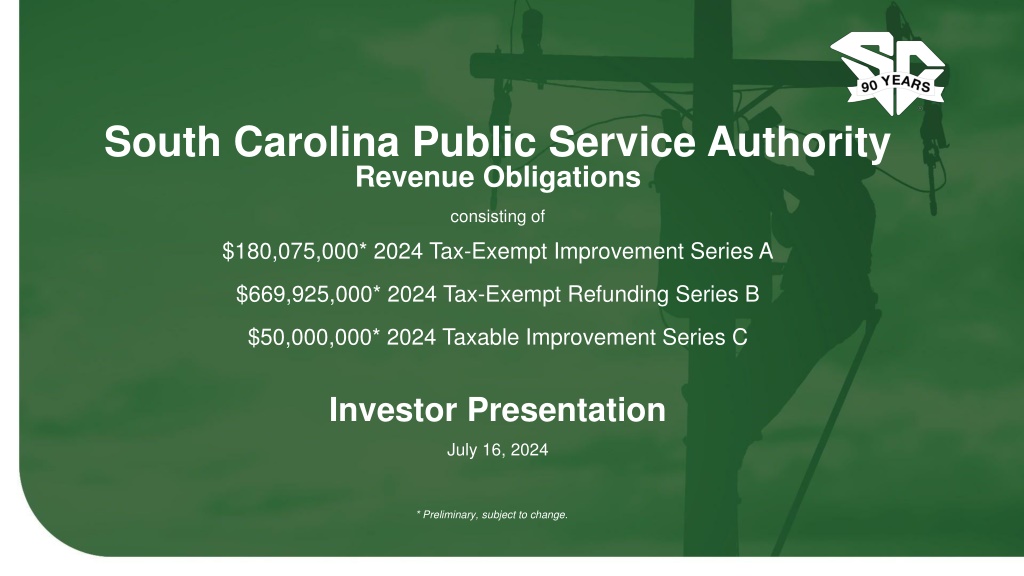
South Carolina Public Service Authority Revenue Obligations consisting of $180,075,000* 2024 Tax-Exempt Improvement Series A $669,925,000* 2024 Tax-Exempt Refunding Series B $50,000,000* 2024 Taxable Improvement Series C Investor Presentation July 16, 2024 * Preliminary, subject to change.
Disclaimer This Investor Presentation you are about to view is provided as of July 16, 2024, for a proposed offering by the South Carolina Public Service Authority (the Authority ) of its Revenue Obligations, 2024 Tax-Exempt Improvement Series A, 2024 Tax-Exempt Refunding Series B and 2024 Taxable Improvement Series C (collectively, the Bonds ). This Investor Presentation is provided for information purposes only and your sole and exclusive use in connection with the proposed offering. The information contained herein is subject to completion and amendment. If you are viewing this presentation after July 16, 2024, there may have been events that occurred subsequent to such date that would have a material adverse effect on the financial information that is presented herein, and neither the Authority nor the Underwriters have undertaken any obligation to update this electronic presentation. All market prices, financial data and other information provided herein are not warranted as to completeness or accuracy and are subject to change without notice. Any investment decisions regarding the Bonds should only be made after careful review of the complete Preliminary Official Statement. By accessing this presentation, you agree not to duplicate, copy, download, screen capture, electronically store or record this Investor Presentation, nor to produce, publish or distribute this Investor Presentation in any form whatsoever. This Investor Presentation does not constitute a recommendation or an offer or solicitation for the purchase or sale of any security or other financial instrument, including the Bonds, or to adopt any investment strategy. Any offer or solicitation with respect to the Bonds will be made solely by means of the Preliminary Official Statement and Official Statement, which describe the actual terms of such Bonds. You will be responsible for consulting your own advisors and making your own independent investigation and appraisal of the risks, benefits, appropriateness and suitability of the proposed transaction and any other transactions contemplated by this presentation and neither the Authority nor the Underwriters are making any recommendation (personal or otherwise) or giving any investment advice and will have no liability with respect thereto. The information contained herein has been compiled from sources believed to be reliable, however neither the Authority nor the Underwriters shall have any liability whatsoever (in negligence or otherwise) to any person for any loss arising from this Investor Presentation or any information supplied in connection therewith. In no event shall the Underwriters or the Authority be liable for any use by any party of, for any decision made or action taken by any party in reliance upon, or for any inaccuracies or errors in, or omissions from, the information contained herein and such information may not be relied upon by you in evaluating the merits of participating in any transaction mentioned herein. Neither the Underwriters nor the Authority makes any representation or warranty as to the (i) accuracy, adequacy or completeness of any information in this Investor Presentation or (ii) legal, tax, credit or accounting treatment of any purchase of Bonds by you or any other effects such purchase may have on you and your affiliates or any other parties to such transactions and their respective affiliates. You should consult with your own advisors and make your own independent investigation and appraisal of the risks, benefits, appropriateness and suitability of the proposed offering. Nothing in these materials constitutes a commitment by the Underwriters or any of their affiliates to enter into any transaction. No assurance can be given that any transaction mentioned herein could in fact be executed. This Investor Presentation contains forward-looking statements that involve risks, uncertainties and assumptions. If the risks or uncertainties ever materialize or the assumptions prove incorrect, the results may differ materially from those expressed or implied by such forward-looking statements. Accordingly, we caution you not to place undue reliance on these statements. All statements other than the statements of historical fact could be deemed forward-looking. All opinions, estimates, projections, forecasts and valuations are preliminary, indicative and are subject to change without notice. Transactions involving the Bonds may not be suitable for all investors. You should consult with your own advisors as to the suitability of the Bonds for your particular circumstances. No assurance can be given that any transaction mentioned herein could in fact be executed. Past performance is not indicative of future returns, which will vary. Clients should contact their salesperson at, and execute transactions through, an entity of the Underwriters qualified in their home jurisdiction unless governing law permits otherwise. 2
Transaction Summary South Carolina Public Service Authority Revenue Obligations 2024 Tax-Exempt Improvement Series A 2024 Tax-Exempt Refunding Series B 2024 Taxable Improvement Series C Estimated Par* $180,075,000 $669,925,000 $50,000,000 Tax Status Tax-Exempt Tax-Exempt Federally Taxable Ratings (M/S/F) Moody s: A3 (Stable) / S&P: A- (Negative) / Fitch: A- (Stable) Finance a portion of the costs of the Authority s capital improvement program for the System Pay certain costs of issuance Finance a portion of the costs of the Authority s capital improvement program for the System Pay certain costs of issuance Refund all or a portion of the Authority s outstanding 2013 Series A, 2013 Series B, 2013 Series E, 2014 Series A and 2014 Series B Bonds Pay certain costs of issuance Use of Proceeds Secured solely by a senior lien on the Revenues of the Authority derived from the ownership and operation of its water and electric power system (as more particularly defined in the Authority s Revenue Obligation Resolution, the System ). Security Structure* Serial and Term Bonds Redemption* 12/1/2034 at par 12/1/2034 at par Make-whole call Senior Manager J.P. Morgan Co-Senior Managers BofA Securities and Barclays Co-Managers Academy Securities, Goldman Sachs, Morgan Stanley, TD Securities, Wells Fargo Pricing* July 23, 2024 Closing* July 30, 2024 * Preliminary, subject to change. 3
The Authority Overview Santee Cooper Jefferies Hydroelectric Station South Carolina s state-owned electric and water utility, created in 1934 One of the nation s largest public power utilities with assets of $12.1 billion and owned system summer capacity of 5,163 MW A source of electricity for approximately 2 million people across South Carolina, and provides wholesale water to more than 210,000 people Rainey Generating Station 5
Key Highlights The Authority Rate Freeze Concludes in January 2025 Stable Operating Profile Positioned For The Future Strong Financial Metrics Authority has a diversified Power Supply portfolio comprised of nuclear, coal, gas, hydro, solar, and landfill gas 2023 Results stronger than initial budget projections: The State of South Carolina s population is growing, resulting in additional load growth The Authority s Board of Directors has autonomous rate setting authority 1.13x Debt Service Coverage1 2023 sales of 26,185 GWh and peak load of 4,940 MW Board received proposed rate changes for retail customers and approved a public comment process. Integrated Resource Plan (IRP) was unanimously approved by the Public Service Commission in March 2024 106 Days Cash on Hand2; 227 Days of Liquidity3 Strong and experienced management team with 125 years of combined utility experience; Jimmy Staton has served as President and CEO since March 1, 2022 Fuel Risk Management4: 95% of the System s MWh needs and 90% of the costs are hedged for the balance of 2024 If approved, rates will be implemented in April 2025 Preferred IRP Plan includes additional solar, retirement of Winyah Generating Station, new baseload natural gas and peaking resources Automatic pass-through rate adjustments will be reinstated January 2025 Substantial levels of coal on the ground (135 days based on average daily burns) Mix of wholesale, direct industrial and direct retail customers Additional resource planning is underway to address updated load forecast which shows significant increase since initial IRP The Authority directly or through wholesale customers serves approximately 2 million South Carolinians (1) Includes bank facilities, after payment to state and excludes the regulatory asset (2) Days of Cash on Hand = (Total Unrestricted Funds x 365 Days) / Total Operating Expense (3) Days of Liquidity on Hand = ((Total Unrestricted Funds + Total Unused Credit Capacity) x 365 Days) / Total Operating Expenses (4) As of March 31, 2024 6
The Authority Overview 2023 Power Supply by Fuel Source (GWh) Business Customers Hydro & Renewable 2% An electric and water utility headquartered in Moncks Corner, South Carolina Retail and wholesale provider serving over 2 million South Carolinians Natural Gas & Oil 21% Owned by the State of South Carolina Provided 26,185 GWh in 2023 to its customers Coal 42% One of the nation's largest public power utilities: Largest customer is Central Electric Power Cooperative, providing approximately 58% of Authority s revenues in 2023 Nuclear 9% $12.1 billion of assets (2023)1 $1.9 billion of revenues (2023) Purchases 26% (1) Includes deferred outflows of resources Rates Revenue by Customer Category (2023) 2023 Sales Composition (GWh) Autonomous rate making ability 1 Retail 15%2 Competitive wholesale and retail rates in state Retail 22% Rate freeze ends at the end of 2024. Approximately 75% of the Authority s costs are recovered through automatic pass-through adjustments which means no action is required by management or the Board of Directors Large Industrial 17% Military & Large Industrial 23% Central 58% Automatic pass-through adjustments will be reinstated January 2025 when the rate freeze ends Any remaining shortfall will be adjusted through the retail rate process underway Wholesale 62% Other Wholesale 3% (1) Retail includes residential, commercial, small industrial and lighting 7
The Authority South Carolinas Economy Strong State Credit Ratings Increasing State Population millions 5.4 6.0 5.3 5.2 5.1 5.1 Rating AAA Aaa AA+ 4.0 2.0 Outlook Stable Stable Stable 0.0 2019 2020 2021 2022 2023 Source: Rating Agency Websites Source: U.S. Census Bureau Growing State GDP Unemployment Rate 12% ($bn) 322.3 350.0 10% 297.5 Thousands 271.5 300.0 249.5 248.0 8% 250.0 6.0% 6% 200.0 4.0% 150.0 3.0% 4% 3.2% 2.8% 100.0 2% 50.0 0% 0.0 2019 2020 2021 2022 2023 2019 2020 2021 2022 2023 Source: U.S. Department of Commerce, Bureau of Economic Analysis Source: U.S. Department of Labor, Bureau of Labor Statistics (seasonally adjusted) 8
The Authority Stable Customer Base and Sales Historical Energy Sales (GWh) Wholesale 18,000 16,000 14,000 12,000 10,000 14,901 8,000 16,294 16,251 15,402 14,564 6,000 4,000 2,000 0 2019 2020 2021 2022 2023 Retail1 Industrial (GWh) (GWh) 8,000 8,000 7,000 7,000 6,002 5,999 6,000 6,000 5,264 5,000 4,435 5,000 83,935 3,995 3,935 3,892 3,935 4,000 4,000 3,674 3,000 3,000 2019 2020 2021 2022 2023 2019 2020 2021 2022 2023 (1) Retail includes residential, commercial, small industrial and lighting 9
The Authority Diversified and Reliable Resource Mix Current Generation Sources 2023 Capacity (MW)1 2023 Fuel Mix (GWh) Hydro & Renewables 3% Hydro & Renewable 2% Natural Gas & Oil 21% Natural Gas & Oil 26% Coal 42% Coal 65% Nuclear 9% Nuclear 6% Purchases 26% Base Load Availability Nuclear Coal Gas (%) 99.4 94.7 100 88.7 85.9 87.9 85.3 82.3 82.5 75.8 80 60 40 20 0 2 3 2021 2022 2023 2021 2022 2023 2021 2022 2023 ____________________________________________ 1. Based on winter capacity and does not include SEPA, Buzzard s Roost and St Stephen 2. 2021- Reflects an outage at Cross 2 3. Fall 2021 36 days for scheduled refueling outage and 26 days of unscheduled outage due to fire 10
Rate Freeze Concludes in January 2025 Retail Rates The Authority s Board has autonomous rate setting authority Rate Setting Certain contracts and retail rate riders that are designed to adjust automatically will be reinstated January 2025. No action is required by Board or management. These adjustments include: Central contract is cost of service where rates adjust to actual (fuel on a monthly basis and non-fuel on an annual basis). Retail rates have fuel adjustment clauses that are based on a 3-month rolling average. Demand sales adjustment clauses are based on a monthly true-up. Approximately 75% of the Authority s costs are recovered with these automatic rate adjustments. Cost Recovery Mechanisms The Board received proposed rate changes for retail customers and approved a public comment process. The proposed rate increase will only impact Retail base rates. The Authority hasn t increased base Retail rates since April 1, 2017. The base rate adjustment would be implemented in April 2025. Cook Rate Freeze Exceptions are not included in the proposed rate adjustment. The Authority s Board has not determined the final amount and term of collection for the exceptions. A collection mechanism for Retail has been proposed but not yet approved by the Board. Central s collection would occur through their cost of service. Retail Rate Adjustment 12
Retail Rates 2024 Rate Study and Proposed 2025 Rate Adjustment Santee Cooper conducted a year-long rate study for the purpose of revising residential, commercial, industrial and lighting class rates ( 2024 Rate Study ) and presented the resulting proposed rates to its Board on June 10, 2024 The recommended rate adjustments (detailed below) include a single adjustment to rates effective in April of 2025 The Cook Rate Freeze Exceptions are anticipated to be collected through a proposed rider added to customers bills and would not be included in the base rate Rate Process Timeline Proposed Average Annual Increase in Revenues 1 Customer Class Proposed Rates in 20252 (vs Present Rates) Board Meeting for interested parties to appear and speak in person and offer comments directly to the Board October 8, 2024 Residential3 8.7% Board meeting to receive management s recommendation concerning proposed rate adjustments November 7, 2024 Commercial 4.1% Lighting 5.0% December 9, 2024 Board s vote on the proposed adjustments Industrial4 2.8% Implementation of the proposed adjustments, if approved TOTAL AVERAGE 4.9% April 1, 2025 1. Average increase in total revenues for all customers in class. Not all customers in a class will experience the same level of adjustment Does not include recovery of Cook exceptions Does not reflect any changes in customer behavior based on new rate design Includes Industrial Firm & Non-Firm 2. 3. 4. 13
Rate Competitiveness Retail Rates Central is the Authority s largest customer (58% of 2023 revenues) Wholesale Central is a wholesale cooperative that provides power to approximately 20 distribution retail cooperatives throughout South Carolina In 2013, the Authority and Central modified their existing power sale agreement; earliest termination extended to 2058 The Authority also has several power sales agreements with regional power providers for various terms (3% of 2023 revenues) The Authority directly serves approximately 200,000 residential, commercial and small industrial retail customers in its assigned retail service territory which includes parts of Berkeley, Georgetown and Horry counties (22% of 2023 revenues) Retail The Authority has seen customer account growth ranging from 2.2%-3.8% per year over the last 5 years The Authority s direct customers currently include 27 large industrial and military customers include Joint Base Charleston, Century Aluminum and Nucor (17% of 2023 revenues) Residential Rate (1,000 kWh) Commercial Rate (5,000 kWh) Industrial Rate (9,000 kW / 5,000,000 kWh) 16.00 16.00 16.00 15.15 14.67 14.09 12.87 14.00 14.00 14.00 12.49 11.22 11.05 12.00 12.00 12.00 10.00 8.89 10.00 10.00 8.67 8.45 7.48 8.00 8.00 8.00 6.04 c/kWh c/kWh c/kWh 6.00 6.00 6.00 4.00 4.00 4.00 2.00 2.00 2.00 0.00 0.00 0.00 Authority Duke Energy Carolinas Duke Energy Progress Dominion Energy SC Authority Duke Energy Carolinas Duke Energy Progress Dominion Energy SC Authority Duke Energy Carolinas Duke Energy Progress Dominion Energy SC Based on rates on file with the SCPSC for the period of June 1, 2023 through May 31, 2024. 14
Integrated Resource Plan Resource Planning The Authority develops integrated resource plans ( IRP ) as part of its overall planning process The Authority is required to prepare and submit an IRP to the South Carolina Public Service Commission ( SCPSC ) every three years with annual updates The Authority filed its IRP for 2023 with the SCPSC in May 2023, and it was unanimously approved in March 2024 (the 2023 IRP ) The Authority will file an update to the 2023 IRP in September 2024 Key Conclusions Addition of substantial new solar capacity annually from 2026 through the 2030s to approximately 1,500 MW by 2030 and over 3,000 MW by 2040 1. Solar Additions 2. Coal Retirement Retirement of 1,150 MW Winyah Coal Generating Station by year-end 2030 Development of a natural gas combined cycle (NGCC) resource of approximately 1,000 MW to coincide with the Winyah retirement - Potential joint build with Dominion 3. New Baseload Gas Addition of several hundred MWs of combustion turbine generation units and battery energy storage systems in the 2030s 4. New Peaking Resources 16
Renewable Resources Resource Planning The Authority and Central entered into purchased power agreements for their respective load ratio share of 200 MW s of solar which is expected to be online in 2025 Since the passage of Act 90 of 2021, the Authority is required to file its Competitive Procurement of Renewable Energy ( CPRE ) program with the SCPSC for its approval The Authority s CPRE program was approved by the Commission in January 2024 The Authority recently issued a solar RFP, with Central s cooperation, in accordance with the approved CPRE program In addition, the Authority is evaluating appropriate Battery Energy Storage System ( BESS ) implementation approach for the Combined System Through future IRPs, the Authority will evaluate impacts of: EPA Greenhouse Gas regulation impacts on existing coal facilities and new natural gas facilities Potential growth in large customer loads Market conditions and trends impacting resource cost assumptions Other considerations that may impact base planning assumptions 17
2024 Financial Plan Highlights Authority Finances Rate freeze will end in January 2025 Approximately 75% of costs will return to recovery through automatic pass-through adjustments The remaining portion will be adjusted through the retail rate process underway Strong projected load growth Substantial near-term load growth from new large customers and expansion of existing large customers The updated load forecast reflects approximately 1,100 MW by 2033 to account for additional expected load Robust capital plan that invests in the electric system Investment in improvements to existing power supply facilities, extensions of and improvements to the transmission and distribution systems, other general improvements and compliance with environmental requirements Capacity expansion Developing a natural gas combined cycle resource of approximately 1,000 MW to coincide with the retirement of Winyah Executed purchase power agreements in 2023 to receive 250 MWs of capacity with optional energy in 2024-2028 Updating Integrated Resource Plan to reflect latest load growth projections Reduced fuel cost System risk mitigation by hedging volume and cost related to natural gas, coal, coal transportation surcharge, and purchased power agreements 19
Cook Settlement Update Authority Finances The Authority has continued to fulfill its requirements under the Cook Settlement as the end of the rate freeze approaches Settlement Amount. The Authority made its full contribution to the Common Benefit Fund of $200 million back to customers in three annual installments ($65m, $65m and $70m) Rate Freeze. Rates were frozen for the majority of the Authority s customers, including Central, beginning August 2020 through December 2024 Regulatory Asset. As of March 31, 2024, the Authority has recorded a total of approximately $637 million as a regulatory asset of Cook Deferred Expenses. Most of this cost is attributable to one exception. These costs are expected to be collected through rates after the rate freeze The last year of the rate freeze in which exceptions could occur will be addressed in the report filed with the Court on April 30, 2025 Resolution Status Update. The Authority, Central Electric Power Cooperative (Central) and Class Counsel have continued discussions on a path forward to resolve contested exceptions. During 2023, the parties reached a potential resolution of Cook Exceptions which required the use of securitization. In January 2024, the Authority's Board authorized staff to work with elected officials to determine if securitization legislation was feasible. Legislation was not introduced, and the Authority continues to work with the other parties to develop a mutually-beneficial alternative solution that builds off the progress made under the previous arrangement. 20
Existing Debt & Liquidity Facilities Authority Finances The Authority s debt management plan includes: Capacity Expiration $ s in thousands Internal funds to manage debt service Barclays LOC 100,000 9/6/24 Barclays LOC 200,000 2/28/25 Executing a multi-faceted refunding program that is staged in tranches and targeted at mitigating risk and taking advantage of interest rate savings Wells Fargo RCA 100,000 3/25/25 Bank of America RCA 200,000 3/20/26 The Authority maintains a bank facility program with aggregate borrowing capacity of up to $1.05 billion (as of March 31, 2024) JP Morgan RCA 250,000 3/31/26 Increased bank facility capacity with Bank of America by $50 million in May 2024 TD Bank RCA 200,000 6/30/26 Currently negotiating with Barclays to extend the LOCs and may increase its capacity Total 1,050,000 Debt Outstanding as of 12/31/231 & Debt Service Schedule2 Debt Outstanding ($ thousands) Revenue Obligation Bonds: Fixed Variable Total Revenue Obligation Bonds Bank Facilities: Commercial Paper Revolving Credit Agreements Total Bank Facilities $ millions Principal Interest 600 $ 6,659,290 124,795 $ 6,784,085 400 200 $ 183,363 403,860 $ 587,223 - 2024 2025 2026 2027 2028 2029 2030 2031 2032 2033 2034 2035 2036 2037 2038 2039 2040 2041 2042 2043 2044 2045 2046 2047 2048 2049 2050 2051 2052 2053 2054 2055 2056 Total Debt Outstanding _____________________________________________ 1. As of December 31, 2023. Also reflects total debt and is preliminary. 2. Debt service on existing debt as of December 31, 2023; includes benefit of BABs subsidy; excludes debt service on outstanding Commercial Paper Notes and loans under the Revolving Credit Agreements; shown on a cash basis. $ 7,371,308 21
Commodity Hedging1 Authority Finances The Authority has hedged a significant portion of its fuel exposure for the remainder of the rate freeze Bal-20242 Volume Coverage 100% 100% 86% 2025 2026 Cost Volume Coverage Coverage 56% 66% 64% Cost Volume Coverage Cost Coverage Coverage Coal Natural Gas Purchased Power - Energy 97% 89% 74% 51% 60% 24% 34% 37% 51% 22% 35% 15% System Overall 95% 90% 63% 47% 43% 24% 1. Coverage is based on the 2024 Budget system exposure which considers the economic dispatch to service our load forecast, the system is set up to fuel switch between resources based on daily pricing which incentivizes leaving some volume open to the market. Coal coverage is targeting a coal pile of 800,000 to 1,200,000 tons. Natural gas is targeting coverage for the Rainey Combined Cycle Unit, the most efficient in the fleet, 100% through 2025 and 50% 2026-2031 as well as other natural gas related exposures for other resources. Purchased Power Energy includes PURPA arrangements for renewables and SEPA as well as agreements for long term purchases through 2028. 2. As of March 31, 2024 22
Upcoming Transaction Structure & Schedule* and Key Contacts Financing Schedule Structure* 2024A Bonds and 2024C Bonds Post POS July 16 Financing a portion of the costs of the capital improvement program of the System Bond Pricing July 23 2024B Bonds Board Approval of Bonds July 24 Refund all or a portion of the Authority s outstanding 2013 Series A, 2013 Series B, 2013 Series E, 2014 Series A and 2014 Series B Bonds Closing July 30 An insurance policy may be obtained for a portion of the Bonds Key Contacts The Authority Public Financial Management Financial Advisor J.P. Morgan Senior Manager Kevin Plunkett Executive Director Faith Williams Manager, Debt Management & Investor Relations (843) 761 8000 Ext 4987 faith.williams@santeecooper.com Michael Mace Managing Director (704) 541 8339 macem@pfm.com (212) 270-7036 kevin.plunkett@jpmorgan.com www.santeecooper.com/about/investors * Preliminary, subject to change. 24
















![Innovative Solutions for Investor Success - [Your Name] & [Your Company Name]](/thumb/196869/innovative-solutions-for-investor-success-your-name-your-company-name.jpg)
