OECD Data Collection Activities Overview
OECD's data collection activities include interrelated work streams focusing on environmental data and indicators, database development, green growth, sectoral statistics, and regional analysis. The organization aims to provide comprehensive information to support policy-making and promote global cooperation in data collection efforts.

Download Presentation

Please find below an Image/Link to download the presentation.
The content on the website is provided AS IS for your information and personal use only. It may not be sold, licensed, or shared on other websites without obtaining consent from the author. Download presentation by click this link. If you encounter any issues during the download, it is possible that the publisher has removed the file from their server.
E N D
Presentation Transcript
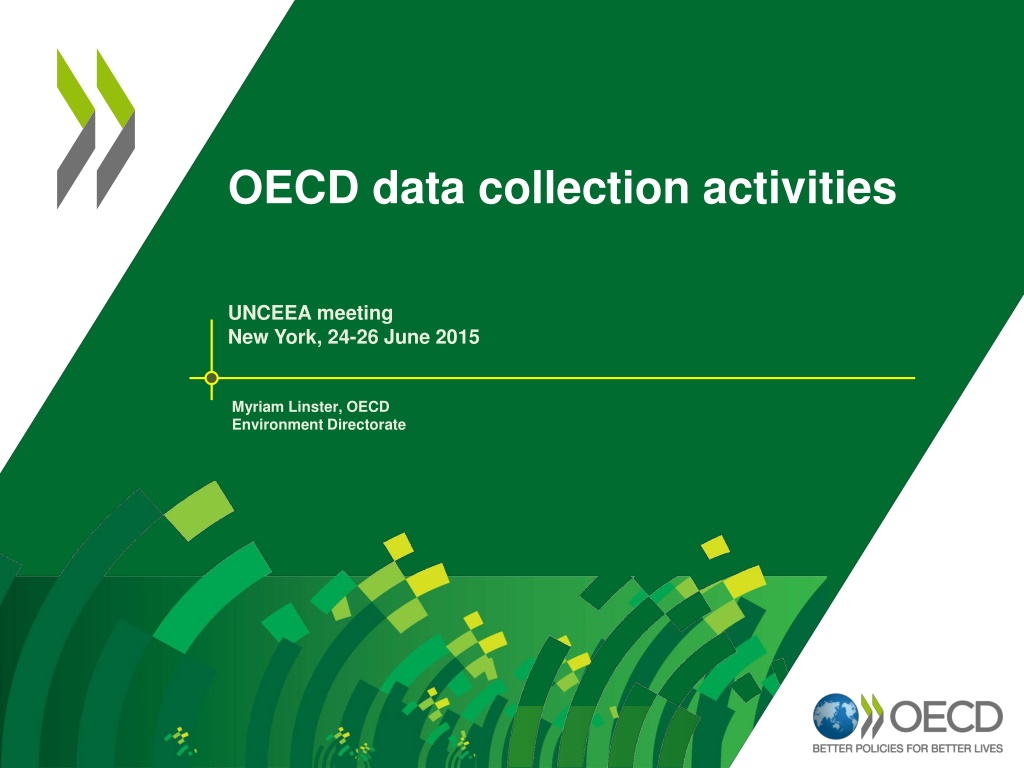
OECD data collection activities UNCEEA meeting New York, 24-26 June 2015 Myriam Linster, OECD Environment Directorate
OECD data collection activities Several interrelated work streams Environment Environmental data and indicators Database on policy instruments Green growth: indicators and database Environmental accounting SEEA implementation Sectoral Agriculture: statistics, agri-environmental indicators, GG indicators Energy: statistics, balances, outlooks, efficiency indicators Transport: statistics, indicators, outlooks Regional and territorial Use in policy analysis and country studies Characteristics Closeness to policy demands and information needs Pragmatic and flexible approach, voluntary reporting Global coherence: international cooperation and joint work 2
Overview of indicator architecture and foundations UN SDGs Measuring well-being and the progress of societies GDP and beyond UNEP, WB UNECE GGKP Better life initiative Better life index How s life? Income inequality Monitoring progress towards Green Growth EU Socio-economic & growth characteristics Environmental and resource productivity Natural asset base Environmental quality of life Economic opportunities and policies National indicators Review & selection: Policy relevance Analytical soundness Measurability SEEA OECD indicators and statistical databases IGOs Energy Agriculture Transport Development aid Investment Trade Economic performance National accounts Productivity Environmental performance Resource productivity Science &Technology Innovation Entrepreneurship Employment Education Member countries 3
OECD environmental data Several data sources and compilation channels Data collection from countries: ministries, agencies, NSOs State of the environment questionnaire (regular since 1977-1982) SEEA core tables: air emissions, natural assets (work in progress) Country environmental performance reviews: additional data, country specific Database on instruments for environmental policy and resource management Data compilation from other OECD and international sources OECD: Energy, transport, agriculture, industry, Convention Secretariats: UNFCCC, Basel, CLRTAP, . UN agencies: UNEP, UNSD, UNECE, FAO, World Bank Eurostat, EEA Other: research institutes, NGOs 4
OECD environmental data State of the environment questionnaire (1) Major tool for harmonised collection at international level OECD Core set of environmental data Regular revisions to align with policy needs and international statistical developments International co-operation and joint work Joint work with Eurostat, data exchange & validation arrangements Close cooperation with UNSD and UNEP: water, waste Cooperation with EEA, Convention Secretariats, etc. Holistic approach PSR model Nine sections Air, inland waters, marine environment, land, forest, wild life, waste, noise, expenditure and revenues Several tables based on accounting concepts 5
OECD environmental data State of the environment questionnaire (2) Regular data collection and treatment Every two years for 3 sections (full details): inland waters, waste, expenditure For EU countries via Eurostat platform Annual quality assurance of environmental reference data Subset needed to calculate key environmental indicators Air and GHG emissions, water resources and abstraction, forest resources, waste water treatment connection rates, municipal waste, threatened species Submitted to countries for validation, updating, documentation, interpretation Other questionnaire sections Used on an ad-hoc basis Data taken from other international data sources Regular use of prefilling 6
OECD Environmental data Data collection and treatment OECD Member & Partner countries DATA SOURCES AND OTHER INPUTS International work on classifications, methodologies, ... Other OECD and International data sources Pre-filling non-OECD countries Questionnaire on the state of the environment UNSD-UNEP SEEA TF Air emissions, natural assets Other national data sources EU Member & Accession States EEA, DGENV Eurostat (joint with Eurostat) Pre-filling Data exchange and validation Data treatment & quality assurance Data harmonisation Online access OECD.stat OECD Core Set of Environmental Data Data interpretation Data analysis Production of: Use in: PUBLICATIONS AND OTHER OUTPUTS Data Compendium Indicators Country profiles Policy analysis Country studies Environmental Performance Reviews
Environmental data collection International cooperation Other countries OECD Member & Partner countries EU Member & Partner countries UNSD/ UNEP Eurostat (EEA) OECD OECD/Eurostat questionnaire on the state of the environment Additional tables Legal reporting obligations Other UNSD-UNEP questionnaire (water, waste) Reference data: annual quality assurance 8
Agri-environmental indicators Regular updating decided Data compilation From existing sources (Eurostat for EU countries, FAO) complemented with data collection from non-EU countries when needed Validation by countries before release Priority areas Nutrient balances Water abstraction: via Annual Quality Assurance (AQA) of environmental reference data (link to state of the environment questionnaire) Agricultural land Pesticides Timelines (June 2015-Q1 2016) 9
Inter-Country Input-Output (ICIO) database Two decades of work and experience Basis for measuring value added, jobs, carbon and raw materials embodied in international trade Publicly available Regular updates Years: 1995, 2000, 2005, 2008-2011 Expanded coverage 61 countries: OECD, EU, G20, most ASEAN, 34 ISIC activities Ongoing developments Accounting for the heterogeneity of firms in industry groupings in national IOTs Develop extended SUTs (with NSOs) Improving timeliness through now-casting Improving indicators on carbon embodied in trade 10
Implementation of the SEEA OECD Work programme 2015-16: Priorities SEEA implementation integrated in OECD programme of work on statistics and on environment Supports production of green growth and environmental indicators, including headline indicators Complements existing regular work OECD Task Force established in 2013 Cooperation with UNSD, World Bank, Eurostat Air emissions Core tables, Database Natural assets Core tables, Database Common valuation methodology for international reporting Technical notes Final reports by Q4 2015 11
SEEA Core tables - Compiling data on air emission accounts Reporting template (core table) based on Eurostat 11 pollutants or gases: CO2, CH4, N2O, HFCs, PFCs, SF6, SOx, NOx, CO, VOC, PM2.5 Industry breakdown based on ISIC rev. 4 Data compilation European countries: via Eurostat (mandatory reporting) Other countries: from countries websites/databases Country coverage so far EU member countries, Norway, Switzerland, Turkey Australia, Canada Data available on OECD website (OECD.Stat) Under : Environment \ Air and Climate \ Air Emission Accounts 12
SEEA Core tables - Compiling data on natural assets Current focus on sub-soil assets (minerals, energy) Stocks and flows Physical and monetary Measurement issues Coexistence of different classification systems for the measurement of remaining stocks (CRIRSCO, SPE-PRMS, UNFC- 2009 and SEEA-2012). To align with the SEEA-2012 classification, data need to be available with a sufficient level of disaggregation in the original classification system and countries need to consider a wide range of resource types so that the (quite large) resource classes advocated by the SEEA-CF can be filled. Even when definitions are aligned, national estimates may be very different from what international data providers publish (e.g: BP, EIA, OPEC, USGS). 13
SEEA Core tables - Compiling data on mineral and energy assets Practical approach Data from national data sources, compiled by OECD Secretariat Use of detailed metadata to explain how the different classifications and aggregates chosen by countries relate to each other and to the SEEA-2012 classification system Validation by countries Establishment of prototype database for selected countries Data in physical units: 7 countries (Australia, Canada, Mexico, the Netherlands, Norway, the United Kingdom and the United States) 13 resources (oil, natural gas, hard and brown coal, iron ore, bauxite, copper, lead, nickel, tin , zinc, gold and silver). Data and metadata to be validated by countries before release on OECD.Stat (by the end of 2015). 14
SEEA Core tables - Compiling data on mineral and energy assets - Metadata template Australia Oil, Natural Gas and Mineral Resource Classification UNFC G axis Proved Measured 1P/1C Low Estimate Probable Indicated Possible Inferred Mineral Project Development Stage (CRIRSCO Sub-Classes) CRIRSCO Solid Mineral Classes SPE-PRMS Classes UNFC E axis UNFC F axis Fundamental Characterization SPE-PRMS Sub-Classes 2P/2C Best Estimate 3P/3C High Estimate On Production On Production 1 1.1 1 2 3 Discovered and Commercially Recoverable Mineral Reserves Approved for Development Approved for Development 1 1.2 1 2 3 SEEA-2012 Class A Reserves Justified for development Justified for Development 1 1.3 1 2 3 1.1 2.1 1 2 3 Development pending Development Pending 2 1.3 1 2 3 Mineral Resources SEEA-2012 Class B 2 2.1 1 2 3 Development on hold On Hold 2 2.2 1 2 3 3.2 1.3 1 2 3 Development Unclarified or on Hold Contingent Resources 3.2 2.1 1 2 3 Development unclarified Unclarified Discovered and Not Commercially Recoverable 3.2 2.2 1 2 3 3.3 1.3 1 2 3 Inventory (not defined in template) SEEA-2012 Class C 3.3 2.1 1 2 3 Development not viable Development not Viable 3.3 2.2 1 2 3 3.3 2.3 1 2 3 Additional Quantities in place Unrecoverable Unrecoverable 3.3 4 1 2 3 Prospect 3.2 3.1 4.1 4.2 4.3 Exploration Results Prospective Resources Lead 3.2 3.2 4.1 4.2 4.3 Undiscovered Play 3.2 3.3 4.1 4.2 4.3 Unrecoverable 3.3 4 4.1 4.2 4.3 Australia's Natural Resource System Reported Categories E axis F axis G axis Economically Demonstrated Resources (EDRs) JORC Reserves and JORC Resources (measured and indicated) Development Pending 15
Implementation of the SEEA Ongoing work and next steps Natural assets Note to clarify the relationships between the SEEA-CF 2012 and other classification systems, i.e. UNFC 2009 (Framework Classification for Fossil Energy and Mineral Reserves and Resources) Proposed amendments to the SEEA-CF Preparation of background paper on valuation methodology (draft: July), including link between extraction costs concepts in the SEEA and in mining companies reports Updated and expanded databases Expansion of country coverage Air emission accounts Integrate into regular data collection process Asset accounts Possible expansion to other assets (renewable resources) Identify areas for further work Next meeting of OECD SEEA TF: 16 October 2015 16
Selected publications and reports Recent Green growth indicators 2014 Material resources, productivity and the environment Towards complete balance sheets in national accounts: the case of mineral and energy resources How s life in your region? Energy Efficiency Indicators: Fundamentals on Statistics Energy Efficiency Indicators: Essentials for Policy Making OECD-FAO Agricultural Outlook 2014 ITF Transport Outlook World Energy Outlook 2015: Special Report on Energy and Climate Change (15 June 2015) Forthcoming Environment at a glance 2015 (early October 2015) How s life? (13 October 2015) World Energy Outlook (November 2015) Regions at a glance (end 2015) 17
Upcoming events Event Location, date InterEnerStat meeting (IEA) Paris, 14-15 September 2015 5th OECD World Forum on Statistics, Knowledge and Policy Mexico, 13-15 October 2015 OECD-UNECE seminar on the SEEA implementation Geneva, 14-15 October 2015 OECD TF on the implementation of the SEEA Central Framework Geneva, 16 October 2015 OECD-UNEP International Expert workshop on demand-based measures of material flows Paris, 20-21 October 2015 (tbc) Working Party on Territorial Indicators Paris, 2 November 2015 Joint Working Party on Agriculture and the Environment Paris, 10-11 November 2015 Working Party on Environmental information, WPEI Paris, 24-26 November 2015 Green Growth and Sustainable Development Forum Enabling the Next Industrial Revolution: systems innovation for green growth Paris, 14-15 December 2015 18
Towards a global data collection programme on environmental-economic accounts 19
Lessons from OECD work and discussion items Success criteria Closeness to policy demands: national, international Continuity and flexibility, institutional arrangements Cost-effectiveness: use synergies, minimise duplication, focus on priority areas Global coherence: cooperation, coordination, joint work Existing international work covers already many SEEA- related topics Energy, Water, Air emissions, Material flows, Environmental protection expenditure, Environmental taxes, Land, EGGS, Agriculture, forestry, food, protected areas, Could be used as a foundation By identify commonalities By applying the subsidiarity principle layered approach as for environmental data or for national accounts (IWGs), 20
OECD data collection and indicator activities - International cooperation and joint work I In nf fl lu ue en nc ce e, ,c co o- -o op pe er ra at ti io on n, ,j jo oi in nt tw wo or rk k EXPERIENCE - PROGRESS Other Member & Partner countries OECD international organisations EXPERIENCE - PROGRESS I In nf fl lu ue en nc ce e, ,c co o- -o op pe er ra at ti io on n, ,j jo oi in nt tw wo or rk k 21
Lessons from OECD work and discussion items How far shall we go? How to proceed? Clarify the purpose of the proposal and priorities Establish a multi-purpose global database on environmental- economic accounts (supply driven; broad scope; ambitious) Contribute to the monitoring of the SDGs by using the added value that the SEEA provides (demand driven; focus on priority areas) Clarify the process Data collection from countries versus data compilation from existing sources (coordinated and layered approach, common concepts) Role of core tables Role of countries, of IGOs, of UNCEEA Level of ambition, feasibility (national, international), cost 22


 database")