Leveraging Blackboard Analytics and Tableau for Data Visualization

Create insightful visualizations on student admissions using Blackboard Analytics and Tableau, accessing real-time data and examining OLAP sources. Learn how to efficiently manage and view data for identifying trends in enrollment strategies. Gain a deeper understanding of data-driven decision management for effective business governance.

Download Presentation

Please find below an Image/Link to download the presentation.
The content on the website is provided AS IS for your information and personal use only. It may not be sold, licensed, or shared on other websites without obtaining consent from the author. Download presentation by click this link. If you encounter any issues during the download, it is possible that the publisher has removed the file from their server.
E N D
Presentation Transcript
DATA VISUALIZATIONS USING BLACKBOARD ANALYTICS AND TABLEAU
PRESENTERS Kris Krishnan CSUB, Office of Institutional Research, Planning & Assessment Michael Bullis CSUB, Information Technology Services
OVERVIEW Creating insightful and impactful Tableau visualizations on student admissions, using Blackboard Analytics Using this process users can access real-time" information Examine OLAP (Online Analytical Processing) data sources
PROVIDING A CONTEXT Managing the volume, variety and velocity of data is critically important to its value, but also of importance is finding ways to organize and view the information to actually be able to identify trends and shifts that might otherwise go unnoticed. Enrollment managers can use this data to direct and assess the strategies imposed for growing their student number efficiently and effectively. The challenge is finding a way to express the data in an efficient way that can be easily read and understood.
SURVEY Who here has Tableau? Who here has Tableau connecting over a live connection? Who here has built or has any kind of ETL platform in place? Is anyone familiar with OLAP? Is this a term you have never heard? Glad you are here!
TECHNICAL OVERVIEW Blackboard Analytics vs Tableau ETL OLAP Perspective
DATA = AN EXERCISE OF INSANITY Cost Ad-hoc reporting We all share (and contribute) this insanity
DATA DATA-DRIVEN DECISION DRIVEN DECISION MANAGEMENT an approach to business governance that values decisions that can be backed up with verifiable data. The success of the data-driven approach is reliant upon the quality of the data gathered and the effectiveness of its analysis and interpretation. (https://whatis.techtarget.com/definition/data-driven-decision-management-DDDM) "quality of the data gathered "effectiveness of its analysis and interpretation Having the right hammer for the job
METHODOLOGIES Manual to Automation Report Evolution ETL model Star Schemas
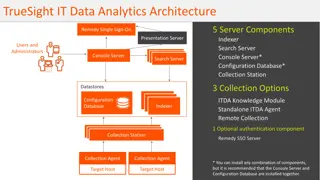
PERFORMANCE BOTTLENECKS Relational database reporting The OLAP layer
https://msdnshared.blob.core.windows.net/media/TNBlogsFS/prod.evol.blogs.technet.com/CommunityServer.Blogs.Components.WeblogFiles/00/00/00/62/41/metablogapi/4578.Cube_thumb_117FF4CD.jpghttps://msdnshared.blob.core.windows.net/media/TNBlogsFS/prod.evol.blogs.technet.com/CommunityServer.Blogs.Components.WeblogFiles/00/00/00/62/41/metablogapi/4578.Cube_thumb_117FF4CD.jpg
IMPLEMENTING ETL WITH OLAP Technological OLAP platform irrelevant Costs: Time, Money and knowledge requirements
ENTER BLACKBOARD ANALYTICS AND TABLEAU We have both. A long story on how we got here.
BLACKBOARD PROS: Provides a running start Lessened knowledge requirements Delivered as a turnkey solution Pyramid front end Demo Time? Full ETL development platform
BLACKBOARD CONS: Pyramid Learning Curve One Size Fits All Overwhelming
TABLEAU PROS: Look at it, it's beautiful! Data source connectivity: Microsoft Excel,Text File,Microsoft Access,JSON File,PDF File,Spatial File,Statistical File,Other Files,Tableau Server or Tableau Online Actian Matrix,Actian Vectorwise,Amazon Athena,Amazon Aurora,Amazon EMR Hadoop Hive,Amazon Redshift,Anaplan,Apache Drill Aster Database,Box,,Cloudera Hadoop,Denodo,Dropbox,Exasol,Firebird,Google Analytics,Google BigQuery,Google Cloud SQL Google Sheets,Hortonworks Hadoop Hive,IBM BigInsights,IBM DB2,IBM PDA (Netezza),Intuit QuickBooks Online,Kognitio,MapR Hadoop Hive Marketo,MarkLogic,MemSQL,Microsoft Analysis Services,Microsoft PowerPivot,Microsoft SQL Server,MonetDB,MongoDB BI Connector MySQL,OData,OneDrive,Oracle,Oracle Eloqua,Oracle Essbase,Pivotal Greenplum,PostgreSQL,Presto,Progress OpenEdge,Salesforce Splunk,SAP HANA,SAP NetWeaver Business Warehouse,SAP Sybase ASE,SAP Sybase IQ,ServiceNow ITSM,SharePoint Lists,Snowflake Spark SQL,Teradata,Teradata OLAP Connector,TIBCO Data Virtualization (Cisco Information Server),Vertica,Web Data Connector Other Databases (JDBC),Other Databases (ODBC)
TABLEAU CONS: "Next generation" visualization tool No ETL development platform It is a barebone system Data extracts and Relational database live connection
THE WIN WIN SITUATION OLAP live connection from Tableau to Blackboard Simple to set up Flexibility
CONCLUSION Dashboards and data analysis can be enormous tools for enrollment management. Identifying the institutional activities that increase the likelihood of enrollment will allow you to enhance your recruitment strategies. Dashboards won t answer every question OLAP connections provide speed and flexibility