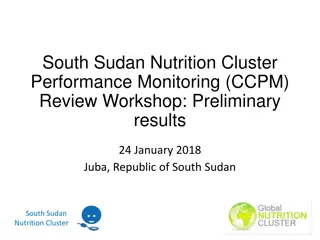
Food Security and Nutrition Monitoring Survey Round 22 Trends

The Food Security and Nutrition Monitoring Survey (FSNMS) Round 22 conducted in June-July 2018 indicates a significant increase in the population in need of humanitarian assistance since August 2012. The survey outlines trends in household food security, food consumption groups, and objectives of FSNMS, highlighting the importance of monitoring key indicators and providing early warning information for potential food security crises. The sampling plan aims to gather representative data at the county level for effective analysis.

Download Presentation

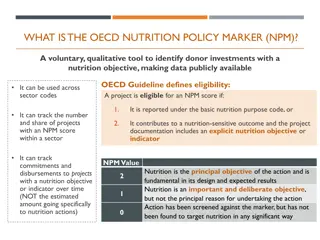
Please find below an Image/Link to download the presentation.
The content on the website is provided AS IS for your information and personal use only. It may not be sold, licensed, or shared on other websites without obtaining consent from the author. Download presentation by click this link. If you encounter any issues during the download, it is possible that the publisher has removed the file from their server.
E N D
Presentation Transcript
Food Security and Nutrition Monitoring Survey (FSNMS) Round 22 June July 2018 See full size image
Trends: Population in need (IPC) Population in need of humanitarian assistance (crisis, emergency and catastrophe) as per IPC, increased from less than 1 million in Aug 2012 to 7.1 million (estimated) in May-July 2018.
Household food security trends 26% 14% 15% 21% 15% 9% 12% FSNMS Round 21 (Dec 2017) findings 10% 11% 8% 1% 6% 10% 10% 3% 56% 53% 50% 49% 39% 38% 37% 37% 34% 33% 33% 32% 30% 30% 28% Jun 11 Jun 16 Nov 15 Dec 16 Aug 17 Dec 17 Oct 10 Oct 11 Jul 12 Oct 12 Jul 13 Oct 13 Jul 14 Oct 14 Jul 15 Moderately food secure Severely food insecure Dec 2017 compared to Dec 2016 15% 13% 25% 18% 6% 10% 7% 22% 16% 8% 19% 14% 6% 17% 15% 13% 13% 26% 11% 11% 12% 8% 69% 68% 68% 67% 64% 62% 61% 61% 58% 57% 56% 56% 54% 54% 53% 53% 52% 44% 43% 43% 41% 40% Dec-16 Dec-17 Dec-16 Dec-17 Dec-16 Dec-17 Dec-16 Dec-17 Dec-16 Dec-17 Dec-16 Dec-17 Dec-16 Dec-17 Dec-16 Dec-17 Dec-16 Dec-17 Dec-16 Dec-17 Dec-16 Dec-17 South Sudan Unity EEQ WBeG Warrap NBeG CEQ Jonglei Upper Nile WEQ Lakes Moderately food insecure Severely food insecure
Food consumption trends Food consumption groups Dec-16 25.7% 44.3% 30.0% Poor Borderline Acceptable
FSNMS Objectives Monitor key food security and nutrition indicators Monitor impacts of food security and nutrition related interventions Provide early warning information of any potential food security crises Key source of information for IPC analysis
FSNMS -22 sampling plan Samples being drawn covering all counties, in order to have estimates of food security indicators at county level useful for IPC analysis Each county to have at 108 households (9 clusters of 12 HHs each) Results on food security indicators will be representative at county level For nutrition, the results shall be representative at a domain consisting of group of counties (3 counties in most cases) Total sample size to be about 8,424; being drawn by NBS
FSNMS timeline 20-23 June Training of trainers in Juba 25 June onwards Training of enumerators in various field locations Field survey July 2 - 25 Aug 1-10 Data cleaning and analysis Mid-August IPC analysis
Implementation Assessment experts from different organizations to participate in ToT Training of enumerators in field locations to be conducted by those participating in ToT Enumerators and logistics for the field survey to be implemented by collaborating (UN/Gov/NGOs) organizations
Participation welcome! lia.pozzi@wfp.org john.vuga@wfp.org krishna.pahari@wfp.org FSNMS round 21 bulletin: https://docs.wfp.org/api/documents/WFP-0000071294/download/?iframe South Sudan VAM documens: http://vam.wfp.org/CountryPage_assessments.aspx?iso3=SSD

")