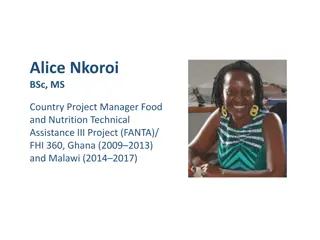
Alina Michalska - Nutrition Specialist with UNICEF ESARO
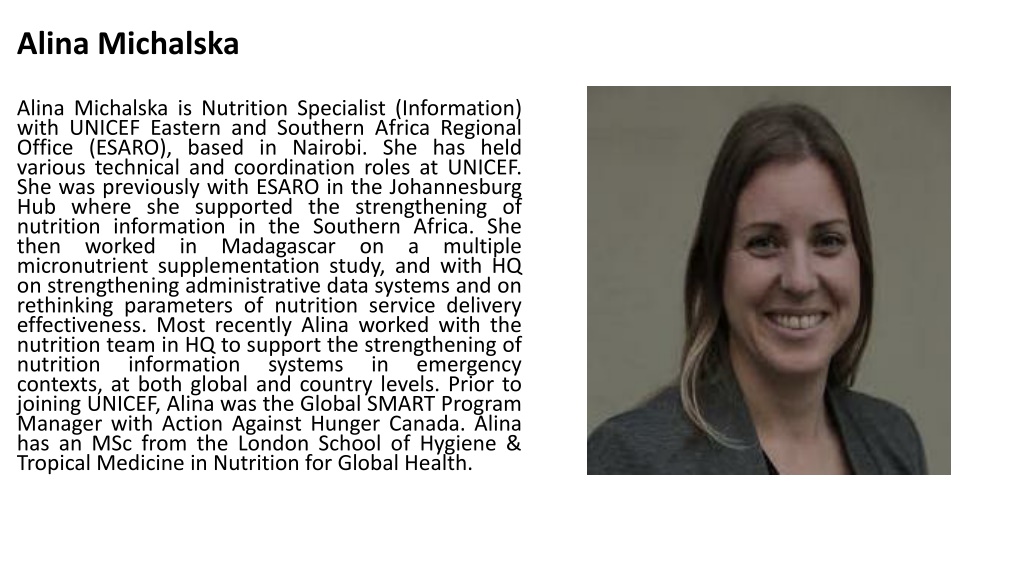
Alina Michalska is a Nutrition Specialist with UNICEF Eastern and Southern Africa Regional Office (ESARO) based in Nairobi. She has a strong background in nutrition information systems and has worked on various projects to improve nutrition outcomes in different regions. With a Master's degree from the London School of Hygiene & Tropical Medicine, Alina is dedicated to enhancing nutrition surveillance and ensuring data-driven action for better nutrition goals.

Download Presentation

Please find below an Image/Link to download the presentation.
The content on the website is provided AS IS for your information and personal use only. It may not be sold, licensed, or shared on other websites without obtaining consent from the author. Download presentation by click this link. If you encounter any issues during the download, it is possible that the publisher has removed the file from their server.
E N D
Presentation Transcript
Alina Michalska Alina Michalska is Nutrition Specialist (Information) with UNICEF Eastern and Southern Africa Regional Office (ESARO), based in Nairobi. She has held various technical and coordination roles at UNICEF. She was previously with ESARO in the Johannesburg Hub where she supported the strengthening of nutrition information in the Southern Africa. She then worked in Madagascar on a multiple micronutrient supplementation study, and with HQ on strengthening administrative data systems and on rethinking parameters of nutrition service delivery effectiveness. Most recently Alina worked with the nutrition team in HQ to support the strengthening of nutrition information systems contexts, at both global and country levels. Prior to joining UNICEF, Alina was the Global SMART Program Manager with Action Against Hunger Canada. Alina has an MSc from the London School of Hygiene & Tropical Medicine in Nutrition for Global Health. in emergency
Data and information for action Learning Network on Nutrition Surveillance (LeNNS) Alina Michalska, UNICEF ESARO 31 May 2023 | Kampala, Uganda
Agenda Data and information for action 01. Global and regional nutrition data recent key findings 02. Nutrition data value chain considerationst point. Use ds and avoid paragraphs. 03. Focus on data for action
Levels and trends in child malnutrition ESAR: 26.0 million ESAR: 4.3 million ESAR: 3.6 million
Regional Trends in Eastern and Southern Africa 2012 2022 2022 2012 2022 Prevalence 37.0 4.3 5.4 4.5 30.9 (%) Number of children (millions) 4.3 3.6 3.3 26.6 26.0
LeNNS Country Trends, 2023 JME Prevalence (%) Country Prevalence Threshold Prevalence Threshold Prevalence Threshold Djibouti 18.7% Medium 3.2% Low 10.6% High Kenya 18.4% Medium 3.8% Low 4.9% Low Malawi 34% Very high 3.9% Low 2.6% Very low Rwanda 29.8% High 4.7% Low 1.1% Very low Somalia 18% Medium 2.7% Low 14.3% High Tanzania 30.6% Very high 4.6% Low 3.3% Low Uganda 23.4% High 3.5% Low 3.6% Low Zambia 31.4% Very high 5.4% Medium 4.2% Low
ESAR: 8.3 million
Common goal Ensure predictable and reliable information on nutrition and nutrition vulnerabilities and determinants for better and timelier decisions for improved nutrition outcomes Plan and prioritise data needs Generate good enough quality data Data use for action
Key components of a national nutrition information system Processes & Procedures People Technology Data
1 Nutrition Status Nutrition-relevant (determinants) data Considerations: Context based Key priority groups Seasonality and other variations
2 Considerations: 1.Routine data Improved coordination & funding Enhanced coverage & programme monitoring Optimized methods & timing (seasonality) 2.Survey data 3.Surveillance data
3 Considerations: Improved capacities Guidance/tools development Older/historical data for extrapolation Flow and access to data 4
5 6 Considerations Who is targeted & influenced Timing, frequency, language, and what information to include
Nutrition information system diagnostic communication products Advocacy for funding or accountability to HRP/Cluster targets Better & timelier decision making Integrated use of needs assessment, situation assessments & program monitoring Focused on visual as opposed to getting the message across Clear messaging based on agreed-upon analysis Poorly disseminated and communicated (hard to find) Communications & advocacy plans co-designed with targeted audience
Data and information serve different purposes Different administrative levels and needs (local, subnational, national, regional, global) Aggregated or hotspot data to prioritise resources Advocacy for investment Etc.
Communication goals and key messages Target audience Type of output What idea or insight do you want the audience to take away and remember from the data visualization? Who is the data visualization trying to reach? How familiar are they with the data and concepts being communicated? How comfortable are they when it comes to interpreting figures, tables and other data visualizations? What type of output will the data visualization be used for (e.g., printed brief, projected presentation, mobile-friendly website)? If considering interactive data visualizations, what is the quality of internet and technology among your target audience? Questions Clear and compelling visualizations are more effective at communicating data. Formatting choices (e.g., colour, font size, title, and labels) can be leveraged for emphasis. Audiences with limited knowledge of the topic area or data types may benefit from annotations in the data visualization that support interpretation. Individuals have variable comfort levels with reading figures and tables (e.g., some people will reject unfamiliar types of visualizations and/or require verbal explanations to orient them). Print quality can influence readability of figures in paper documents. For a projected presentation, room size, screen size, projector quality and lighting in the room can all affect visibility. Formatting requirements vary for desktop and mobile devices Interactive data visualizations may not be appropriate for settings with limited internet connectivity. Examples of why this is relevant
Making data understandable to stakeholders is key to influencing and informing decision-making on nutrition policies and programmes.
Building a culture of data use requires a sustained commitment by institutions and individuals that is: Consistently supported Regularly assessed for effectiveness (data-driven actions) Easily accessible (including feedback to service users)
Thank you. For further enquiries kindly reach out to UNICEF ESARO Nutrition Specialist (Information), Alina Michalska amichalska@unicef.org