Validation of NHS Scotland Employee Engagement Index Presentation
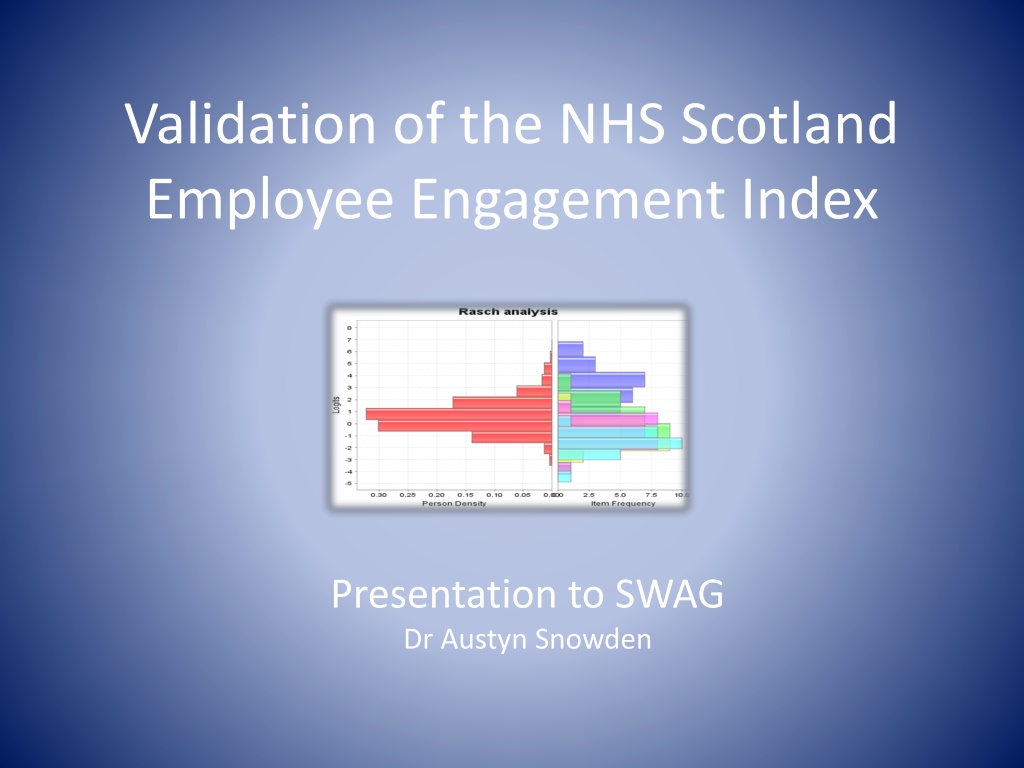
This presentation covers the validation process of the NHS Scotland Employee Engagement Index presented to SWAG Dr. Austyn Snowden. It includes an overview of the NHSEEI, bespoke sample and assumptions, descriptive and inferential statistics, and conclusions and recommendations based on the data collected.

Download Presentation

Please find below an Image/Link to download the presentation.
The content on the website is provided AS IS for your information and personal use only. It may not be sold, licensed, or shared on other websites without obtaining consent from the author. Download presentation by click this link. If you encounter any issues during the download, it is possible that the publisher has removed the file from their server.
E N D
Presentation Transcript
Validation of the NHS Scotland Employee Engagement Index Presentation to SWAG Dr Austyn Snowden
NHSEEI overview Bespoke Sample and assumptions Descriptive statistics Summary Inferential statistics Conclusions & recommendations
Sample and return in pilot 3 Jan Feb 2013 the pilot 3 version of the NHSEEI (Bespoke) was distributed to 2300 NHSScotland staff across three boards: NHS Forth Valley, NHS Tayside and NHS Golden Jubilee. 1280 people returned the questionnaire in total, an excellent return of over 56% those staff targeted, and more than double the 27% return of the 2010 staff survey. 1193 studied after missing data removed.
Assumptions: raw data v logical data Items 4, 16 and 22 are reversed items. They start I do not . A positive response (eg strongly agree) to these items therefore logically translates to a negative response. The participant is expressing a negative view by positively endorsing the item. We therefore draw distinctions here between raw data and logical data. Descriptive data is presented as raw data. From an inferential statistical perspective we use logical data.
NHSEEI sample (N=1193) Corporate Managerial Support services Other AHP Medical Admin/clerical Nursing 0 100 200 300 400 500 600
NHSScotland workforce Personal care Emergency serv Other Healthcare sci AHP Medical Admin/clerical Nursing 0 5 10 15 20 25 30 35 40 45 50 %
1193 responses:Positive v negative (Raw data) Median I feel involved in decisions relating to my organisation I feel appreciated for the work I do I am given the time and resources to support my learning and I get enough helpful feedback on how well I do my work I do not have sufficient support to do my job well I feel involved in decisions relating to my job I have confidence and trust in senior managers responsible for I am confident performance is managed well within my I do not feel involved in decisions relating to my team I feel my organisation cares about my health and wellbeing I am confident my ideas and suggestions are acted upon Strongly Disagree I am confident my ideas and suggestions are listened to I would recommend my organisation as a good place to work Disagree I am confident performance is managed well within my team Slightly Disagree I feel my direct line manager cares about my health and wellbeing Slightly Agree I get the help and support I need from other teams and services I have confidence and trust in my direct line manager Agree I am treated with dignity and respect as an individual Strongly Agree My work gives me a sense of achievement I am treated fairly and consistently My direct line manager is sufficiently approachable I would be happy for a friend or relative to access services within I would recommend my team as a good one to be part of My team works well together I do not feel senior managers responsible for the wider I get the information I need to do my job well I understand how my role contributes to the goals of my I am clear what my duties and responsibilities are 0% 10% 20% 30% 40% 50% 60% 70% 80% 90% 100%
Likert response summaries ranked positive to negative (Raw data) Median I am clear what my duties and responsibilities are My direct line manager is sufficiently approachable I have confidence and trust in my direct line manager I feel my direct line manager cares about my health and wellbeing I would recommend my team as a good one to be part of My work gives me a sense of achievement My team works well together I do not feel senior managers responsible for the wider I am treated with dignity and respect as an individual I am treated fairly and consistently I get the information I need to do my job well Strongly Disagree I understand how my role contributes to the goals of my Disagree I am confident performance is managed well within my I would be happy for a friend or relative to access services within Slightly Disagree I feel appreciated for the work I do Slightly Agree I get enough helpful feedback on how well I do my work I am confident my ideas and suggestions are listened to Agree I would recommend my organisation as a good place to work Strongly Agree I feel involved in decisions relating to my job I am given the time and resources to support my learning and I do not feel involved in decisions relating to my team I do not have sufficient support to do my job well I feel my organisation cares about my health and wellbeing I get the help and support I need from other teams and services I am confident my ideas and suggestions are acted upon I have confidence and trust in senior managers responsible for I am confident performance is managed well within my team I feel involved in decisions relating to my organisation 0% 10% 20% 30% 40% 50% 60% 70% 80% 90% 100%
About me (*raw data) Median I am clear what my duties and responsibilities are I get the information I need to do my job well I am given the time and resources to support my learning and growth I do not have sufficient support to do my job well* I am confident my ideas and suggestions are listened to I am confident my ideas and suggestions are acted upon I feel involved in decisions relating to my job I am treated with dignity and respect as an individual I am treated fairly and consistently I get enough helpful feedback on how well I do my work I feel appreciated for the work I do My work gives me a sense of achievement
My team (*raw data) Median I feel my direct line manager cares about my health and wellbeing My direct line manager is sufficiently approachable I have confidence and trust in my direct line manager I do not feel involved in decisions relating to my team* I am confident performance is managed well within my team My team works well together I would recommend my team as a good one to be part of
My organisation (*raw data) Median I understand how my role contributes to the goals of my organisation I feel my organisation cares about my health and wellbeing I do not feel senior managers responsible for the wider organisation are sufficiently visible* I have confidence and trust in senior managers responsible for the wider organisation I feel involved in decisions relating to my organisation I am confident performance is managed well within my organisation I get the help and support I need from other teams and services within the organisation to do my job I would recommend my organisation as a good one to be part of I would be happy for a friend or relative to access services within my organisation
NHSEEI calculations (logical data) Individual and team NHSEEI is calculated by summing all the scores for each category and weighting them as follows (reversed in reversed items): Strongly Agree = 6 Agree = 5 Slightly agree = 4 Slightly disagree = 3 Disagree = 2 Strongly Disagree = 1 This is then turned into % by dividing by 168 [the maximum possible total (28x6)] and multiplying by 100.
Total Spread of NHSEEI responses Mean 69%. Likert category: Agree 45 40 35 30 Number of respondents 25 20 15 10 5 0 24% 39% 47% 55% 64% 72% 80% 89% NHSEEI %
Total Spread of NHSEEI responses Mean 69%. Likert category: Agree 45 40 35 30 Number of respondents 25 20 15 10 5 0 24% 39% 47% 55% 64% 72% 80% 89% NHSEEI %
Representing team NHSEEI Team NHSEEI represents average response of a particular subgroup Team NHSEEI could be respresented as a point on the improve monitor celebrate scale We will use profession to illustrate some possibilities
Mean NHSEEI by profession Mean. 69% Likert equivalent: agree NHSEEI 90% 80% 70% 60% 50% 40% 30% 20% 10% 0% Managerial Admin/clerical Medical Nursing AHP Other Corporate Support Services NHSEEI 77% 73% 70% 69% 68% 67% 66% 62%
Mean NHSEEI by profession 66% and below 67% and above NHSEEI 90% 80% 70% 60% 50% 40% 30% 20% 10% 0% Managerial Admin/clerical Medical Nursing AHP Other Corporate Support Services NHSEEI 77% 73% 70% 69% 68% 67% 66% 62%
Team NHSEEI (calculable for any subgroup) 100% 100% 90% 90% 80% 80% Managers 70% 70% Support Services 60% 60% 50% 50% 40% 40% 30% 30% Celebrate Celebrate 20% 20% Monitor Monitor 10% 10% Improve Improve 0% 0% Team NHSEEI Team NHSEEI
Summary of descriptive data Mean staff response to the questionnaire is positive. Median overall response is Agree once reversed items removed. Managers are the most engaged at average 77% NHSEEI. Support services average 62% (slightly agree) Any team NHSEEI can be calculated in the same way.
Total spread of item 29 responses 350 300 Mean. 6.36 Number of respondents 250 200 150 100 50 0 0 1 2 3 4 5 6 7 8 9 10 Overall working within my organisation:
Item 29. Same calculation different representation 10% Celebrate Maintain/Monitor 34% 400 400 Improve 56% Number of respondents Number of respondents 300 300 200 200 100 100 0 0 0 0 1 1 2 2 3 3 4 4 5 5 6 6 7 7 8 8 9 10 9 10 Overall working within my organisation: Overall working within my organisation:
Correlation between NHSEEI & item 29 100 90 80 Number of respondents 70 60 NHSEEI 50 40 30 20 10 NHSEEI % 0 1 2 3 4 5 6 7 8 9 10 0 0 1 2 3 4 5 6 7 8 9 10 Overall working within my organisation is a..0-10 experience Overall working within my organisation:
Summary There is a very significant correlation between item 29 (overall within my organisation ) and NHSEEI. Item 29 could offer a useful snapshot summary. Item 29 should never be used in isolation however as it has not been tested independently of the NHSEEI.
Factor analysis Reducing 28 items into grouped factors means we can better interpret the meaning of the whole. This is done by ascertaining correlations between patterns of responses then explaining the patterns.
Factor structure Quality Strategy Staff governance standards McLeod Enablers Because of this Staff coproduction We know this is valid NHSEEI Factor 2 Factor 3 Factor 1 Factor 4 About my organisation About my line manager About me About my team 3 5 3 6 5 5 4 3 3 5 5 3 5 2 1 5 5 3 6 2 2 5 2 2 1 5 2 3 5 2 5 4 3 3 5 2 3 5 3 3 5 2 3 6 5 5 5 3 2 6 5 6 5 3 1 4 3 3 5 1 2 4 1 5 5 1 5 5 2 5 5 1 1 5 1 5 5 1 1 5 1 5 5 1 2 5 2 4 5 1 5 3 1 3 5 2 1 2 3 5 5 3 3 3 4 6 5 5 3 3 2 6 5 5 5 5 3 6 5 4 5 4 1 4 5 4 4 5 2 2 3 1 4 4 2 3 5 1 2 5 2 3 5 1 3 2 3 4 5 1 3 4 4 5 5 1 4 4 1 5 5 2 5 4 2 5 5 5 And this 5 6 5 6 5 5 3 6 5 5 5 4 5 3 5 6 4 6 4 4 4 4 4 5 5 5 4 5 2 4 3 4 4 5 5 6 5 6 4 6 4 5 2 3 2 5 2 4 2 4 4 5 2 6 5 6
Rasch Analysis Tests the assumption that we are measuring one underlying trait: staff engagement. Identifies items that don t fit this assumption. Identifies how difficult individual items are. Identifies how capable individuals are.
All items 2 Clear misfitting items Hardest item 1 0 0 1 2 3 -1 Easiest item -2
Reverse items removed. Good overall fit 2 1 Measures 0 0 1 2 -1 -2 Infit Mean-square
Person item map Item spread. Nicely covers the person spread Person spread mainly positive (>0) Strongly agree/agree The logit scale represents the item difficulty and the person ability on the same scale. This means we can estimate likely response if we know person ability and vice versa Agree/Slightly agree Slightly agree/Slightly disagree Slightly Disagree/Disagree Disagree/Strongly Disagree This small block represents people of low ability . In this scale ability refers to engagement. It means they are the least engaged This block represents the point at which it is equally likely people will answer this question strongly disagree/disagree. It is the easiest parameter in the easiest question
Person item map Strongly agree/agree Agree/Slightly agree The Rasch analysis shows that the range of questions that make up the NHSEEI tap into a meaningful and diverse range of staff engagement. It is a useful measure across a range of abilities and thus useful measure of change Slightly agree/Slightly disagree Slightly Disagree/Disagree Disagree/Strongly Disagree
Interpretation of factor AND Rasch analysis 4 factors explain most variance, consistent with the structure of the NHSEEI: 1. My experience as an individual 2. My experience with my direct line manager 3. My experience with my team 4. My experience with my organisation Heat map scanning suggested this is a function of robust model as opposed to absence of variance in item responses. Reversed items did not fit with either the factor analysis or the Rasch analysis. The item spread nicely covers the person spread indicating the scale is a very useful and sensitive measure across the whole range of staff engagement.
Final thoughts from focus group Participants sometimes missed the managers name, even though it was specified on the questionnaire. All very positive about the style and layout of questionnaire. They were particularly impressed with the short time it took. Add a timescale to clarify period response refers to Despite one or two comments about reducing the scale the six point scale was broadly popular. Finally there was a very strong message that these results need to be published and fed back to participants for action. Otherwise the NHSEEI will come to be seen as a paper exercise and disengagement will ensue.
Recommendations Remove the reversal of items 4, 16 and 22, otherwise leave the 28 items as they are. Add a timescale to specify the response period. Keep item 29. Keep sample sizes comparably high in subsequent iterations to maintain the level of credibility achieved here. Use summary metrics consistent with Likert response meanings: (0-33% poor, 33-66% medium, 67%+ good) Ensure participants remain involved in the feedback and evolution of NHSEEI. Test NHSEEI nationally. Rollout the NHSEEI simultaneously with any proposed continuation of previous staff survey to: establish construct validity between the two measures and to ascertain which measure staff prefer.


")


")
")
")
")