Baltimore City High-Speed Data Access Analysis
The Baltimore City Speed Test Data analysis examines the internet speed access in various communities within Baltimore City. The report includes details on average download speeds, communities with the lowest speeds, and a comparison of internet speed requirements for different online activities. The data reveals disparities in access to high-speed data across different neighborhoods, highlighting areas that may require improved infrastructure for better internet connectivity.

Download Presentation

Please find below an Image/Link to download the presentation.
The content on the website is provided AS IS for your information and personal use only. It may not be sold, licensed, or shared on other websites without obtaining consent from the author. Download presentation by click this link. If you encounter any issues during the download, it is possible that the publisher has removed the file from their server.
E N D
Presentation Transcript
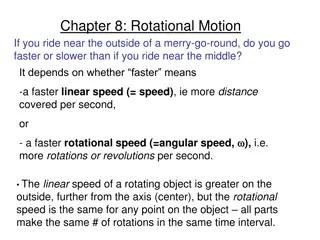
Baltimore City Speed Test Data ARE ALL BALTIMORE CITY COMMUNITIES GETTING ACCESS TO HIGH SPEED DATA?
Background Information The internet speed tests conducted by the Measurement Lab include (not exhaustively) of upload speeds, download speeds, round trip time (RTT). The super fastest internet speed advertised by some internet providers is about 1,000 megabites per second (mbps) and a slower internet speed (basic internet plan) will be around 25 mbps. If you want ... You'll need about... General web surfing, email, social media 1 Mbps Internet Speed 25 Mbps Users Supported 1-2 Speed Summary Basic Online gaming* 1-3 Mbps 100 Mbps 3-4 Average Video conferencing** 1-4 Mbps 200 Mbps 4-5 Fast Standard-definition video streaming 3-4 Mbps 500 Mbps 5+ Very Fast High-definition video streaming 5-8 Mbps 1000 Mbps 5+ Gigabit Frequent large file downloading 50 Mbps and up Broadbandnow.com Nerdwallet.com
Average Download Speeds 2020 Southwest Baltimore Greenmount East Downtown/Seton Hill Median 2020 Download Speeds Northwood Washington Village/Pigtown Southeastern Pimlico/Arlington/Hilltop Madison/East End North Baltimore/Guilford/Homeland Cedonia/Frankford Midway/Coldstream Madison/East End Sandtown-Winchester/Harlem Howard Park/West Arlington Clifton-Berea Harford/Echodale Pimlico/Arlington/Hilltop Hamilton Greater Govans Oldtown/Middle East Glen-Fallstaff Westport/Mount Fells Point Dickeyville/Franklintown Dorchester/Ashburton Cross-Country/Cheswolde Downtown/Seton Hill Cherry Hill Patterson Park North & East Brooklyn/Curtis Bay/Hawkins Point Beechfield/Ten Hills/West Hills Orangeville/East Highlandtown Medfield/Hampden/Woodberry/Remington Unassigned -- Jail Upton/Druid Heights Greater Rosemont Oldtown/Middle East South Baltimore Dorchester/Ashburton Chinquapin Park/Belvedere 15.4 15.42 15.44 15.46 15.48 15.5 The Waverlies Orangeville/East Highlandtown 51.115 51.116 51.117 51.118 51.119 51.12 51.121 51.122 51.123
Interactive Map Link: https://www.google.com/maps/d/ed it?mid=1OrqUgMEBWA-kswLi- IJ575PHofSpxMzj&usp=sharing
Baltimore Communities with the lowest Average Download Speed Community Average Speed(mbps) 51.116600 51.116967 51.117055 51.117123 51.117201 51.117424 51.117483 51.117553 51.117584 51.117696 51.118042 51.118184 Q1 (25%) 3.6391 3.6390 3.6383 3.6468 3.6451 3.6366 3.6462 3.6455 3.6443 3.6433 3.6412 3.6480 Median 15.4764 15.4556 15.4500 15.4649 15.4483 15.4483 15.4766 15.4666 15.4715 15.4571 15.4496 15.4733 Q3 (75%) 48.7871 48.7509 48.7074 48.8004 48.7943 48.7186 48.7464 48.7686 48.7404 48.7598 48.7374 48.8057 Top 95% 217.3765 217.0754 217.3692 217.5852 217.3948 217.0319 217.1376 217.0327 217.4517 217.0754 217.2937 217.3703 Orangeville/East Highlandtown Sandtown-Winchester/Harlem Park The Waverlies Southern Park Heights Chinquapin Park/Belvedere Mount Washington/Coldspring South Baltimore Cedonia/Frankford Oldtown/Middle East Greater Roland Park/Poplar Hill Upton/Druid Heights Allendale/Irvington/S. Hilton
Summary Not exhaustive (voluntary participation, does not account for those without internet) The data is very uniform across Baltimore City Baltimore city as a whole: about 61% have speeds at or below 25mbps Maryland as a whole: about 35% have speeds at or below 25mbps There is so much more to be explored on this issue