Understanding Speed and Distance in Different Scenarios
Explore various scenarios involving speed and distance, such as calculating gradients of line segments, solving equations, determining average speeds of individuals like Felix Baumgartner and a snail named Archie, and understanding the concept of speed not being constant through examples like Earth's orbit. Dive into graph analysis to estimate speeds and distances in real-world situations, like estimating the speed of a ball thrown in the air at different time intervals.

Download Presentation

Please find below an Image/Link to download the presentation.
The content on the website is provided AS IS for your information and personal use only. It may not be sold, licensed, or shared on other websites without obtaining consent from the author. Download presentation by click this link. If you encounter any issues during the download, it is possible that the publisher has removed the file from their server.
E N D
Presentation Transcript
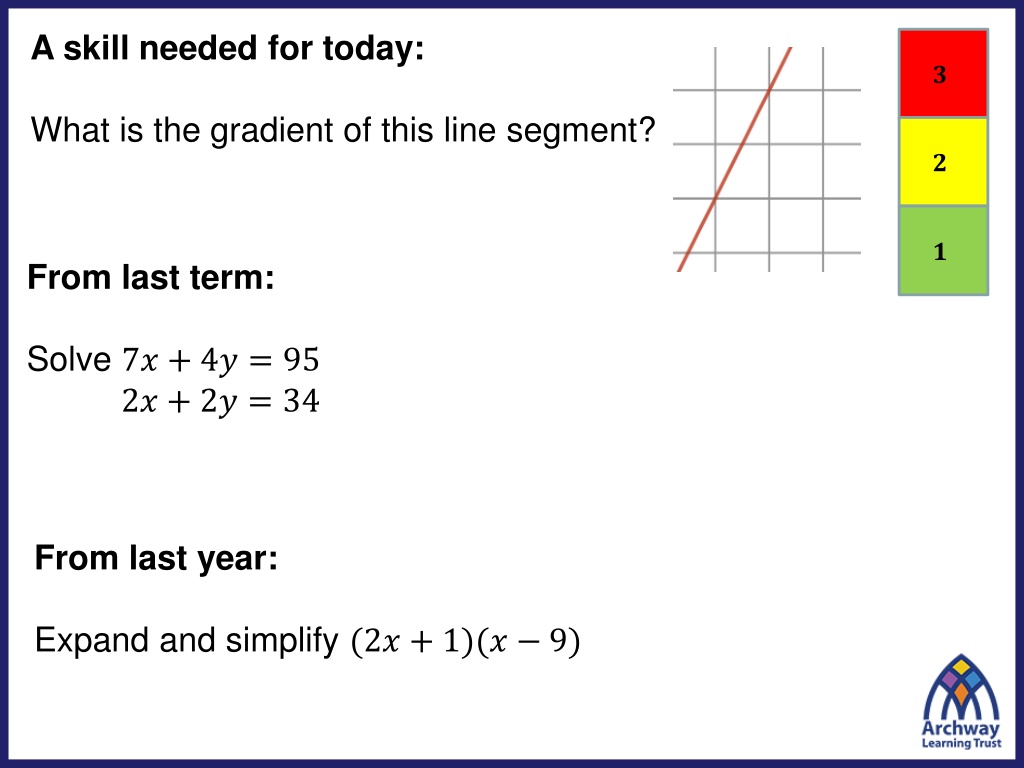
A skill needed for today: ? What is the gradient of this line segment? ? ? From last term: Solve 7? + 4? = 95 2? + 2? = 34 From last year: Expand and simplify (2? + 1)(? 9)
Mark your work Gradient = 2 ? = 9,? = 8
Calculate the average speed Felix Baumgartner recently set a number of records by jumping out of a balloon 39km above the ground. At one point he was travelling faster than the speed of sound. Altogether he took about 10 minutes to reach the ground. What was his average speed in km per minute? According to the 1998 Guinness Book of World Records, the winner of the 1995 world snail racing championships was a garden snail named Archie which completed the 33cm racecourse in exactly 2 minutes. What was the speed of the snail, in cm per minute? The earth is hurtling through space in its orbit around the sun. Since we re all travelling with it at the same speed (relative to the sun) we don t notice the effect, but every year (around 365 days) we accompany our planet on a 940 million km journey around the sun. What speed is this, in kilometres per day? Put these in order from slowest to fastest with calculations to support your answer.
Mark your work Felix: 3.9 km/min Snail: 16.5 cm/min Earth: 2575342 km/day Order: Snail 0.0099km/h, Felix 234 km/h, Earth 107306 km/h
A ball is thrown in the air from a height of 1m above the ground. ??? ? (?) ????(?) Sketch a graph that shows the distance of the ball from the ground until the ball hits the ground.
Why is the line curved and not straight? ??? ? (?) ??? ? (?) 1 1 ????(?) ????(?) Speed is not always constant
Here is the graph with all values marked on the axes. How could we estimate the speed of the ball at 1 second?
Using a tangent to the curve can estimate the distance travelled in a given time interval. Distance Time Distance = 1 m Time Taken = 0.8 s Speed = 1 0.8 = 1.25 ?? 1
Your Turn 1. Work out the speed of the ball when t = 2 seconds 2. After how many seconds did the ball reach its maximum height? 3. Which sketch graph shows the speed of the ball?
The graph shows the distance of a space shuttle from Earth over a 2 minute period. 1. Work out the average speed for the 2 minutes journey in km/min 2. Estimate the speed of the space shuttle at 90 seconds in km/s
The graph shows the distance that a car has travelled in its first minute measured from a point on a road. 1. Calculate the average speed of the car for the entire journey in m/s 2. Estimate the speed at the following times: Time 10 20 30 40 50 Speed 3. Use this to sketch a speed distance graph
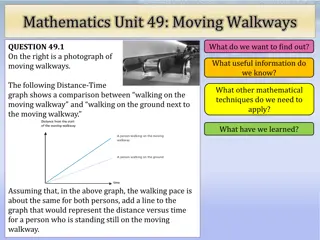
Challenge I walked to the bike shop at a speed of 3 miles per hour, and cycled back along the same route of 12 miles per hour. What was my average speed for the whole trip?