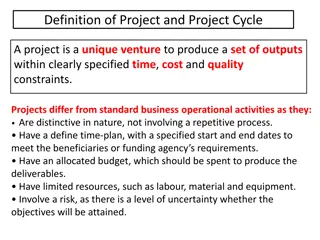
Project Appraisal Process in Government of India
The project appraisal system in the Government of India is well-structured and institutionalized, involving various bodies like the Public Investment Board (PIB) and Project Appraisal Division (PAD). Established in 1972, these bodies play crucial roles in evaluating and managing projects to ensure efficient use of resources. Appraisal by agencies like the Project Appraisal and Management Division and Environment Impact Assessment Division are essential in decision-making for projects of significant scale and impact.

Download Presentation

Please find below an Image/Link to download the presentation.
The content on the website is provided AS IS for your information and personal use only. It may not be sold, licensed, or shared on other websites without obtaining consent from the author. Download presentation by click this link. If you encounter any issues during the download, it is possible that the publisher has removed the file from their server.
E N D
Presentation Transcript
Appraisal of Projects by R. Y. Kadeer, Consultant (PAMD) & Former Joint Adviser Project Appraisal & Management Division Planning Commission Government of India Email: rkadeer@nic.in 1 1
Appraisal Structure System of Project Appraisal is highly structured and institutionalized. All Plan Schemes/projects pass through distinct phases with clearly laid down institutional mechanism. A formal institutional set-up was established in 1972. 2 2
Public Investment Board (PIB) PIB was set-up in 1972 in Ministry of Finance: Examination of the broad contours of an investment proposal to prepare Feasibility Report Taking investment decision on proposals for public investment Consideration of proposals for revision in cost estimates. 3 3
Project Appraisal Division (PAD) PAD was set up in 1972 in Planning Commission to: Develop formats & guidelines for the submission of proposals for the projects/programs. Undertake support studies for improving appraisal methodology and procedures. Undertake the techno economic appraisal of major projects and programs in the public sector. Assist Central Ministries in establishing proper procedures for preparation of Feasibility Reports. 4 4
Appraising Agencies Project Appraisal & Management Division Planning Commission Department of Expenditure Plan Finance (II) Ministry of Environment & Forests Environment Impact Assessment (EIA)Division 5 5
Appraisal by PAMD EFC/PIB Plan Proposals Costing Rs. 100 Crores and above. New and Revised Cost Proposals. Railway Projects Costing Rs. 300 Cr. and above. Proposals of Ministry of Defense, Deptt. Of Atomic Energy and Space are exempted from PIB/EFC. Projects of Navaratna Companies are not appraised by PAMD. 6 6
Forum for Appraisal Cost of Project/Scheme System of Appraisal Ministry/Department concerned, in normal course < Rs. 25 Cr. SFC chaired by the Secretary of the Department concerned. > Rs. 25 Cr. & < Rs.100 Cr. >Rs.100 Cr. & < Rs.300 Cr. EFC Chaired by the Secretary of the concerned Ministry/Department. PIB/EFC Chaired by Secretary, Department of Expenditure > Rs.300 crore **Projects /Schemes where financial returns are quantifiable are to be considered by PIB and others by EFC 7 7
Authority for Approval Approval Authority Financial limits Rs. cr. <25 Secretary of Administrative Ministry = 25 & <150 Minister in-charge of Administrative Ministry >150 & <300 Minister of Adm. Ministry & Finance Minister. =>300 Cabinet/CCEA New autonomous bodies Cabinet/CCEA (Irrespective of Cost) 8 8 8
Investment Decision Stages Identification of New Project/Scheme IPA from Secretary (PC) for new scheme in Plan Circulation of EFC/PIB Memo by Ministry Appraisal by PAMD (PC) Recommendation by EFC/PIB Full PC Approval for new CSS Approval by CCEA/Cabinet 9 9
Time Frame for Appraisal & Approval Process Time Decision on in principle approval 4 weeks Preparation of DPR and its circulation Varies from Project to Project Appraisal of DPR & draft EFC/PIB memo by Appraisal agencies 4 weeks Circulation of Final EFC/PIB Memo 1 week EFC/PIB meeting after final EFC/PIB memo 4 weeks Issue of the minutes of EFC / PIB Submission for approval of Adm. Minister & FM (for projects of >Rs. 150 cr & < Rs. 300 cr) 1 week 2 weeks Sub. to Cabinet/CCEA for approval (>Rs. 300 cr) 4 weeks 10 10 10
Project Appraisal Aspects 1. Need and justification 2. Design & Technological aspects 3. Implementation & Monitoring Mechanism 4. Plan Provision and Financing Arrangement 5. Reliability of Cost Estimates 6. Financial/Commercial Viability 7. Economic Viability 8. Environmental Aspects 9. Risk/Sensitivity Analysis 11 11
Project Formulation Identification & Objective Type of Scheme-CS or CSS Description, location, area, population coverage New or Ongoing Scheme Impact Objectives- as related to Govt. policy, Plan Convergence with other schemes Outputs & Outcomes 12 12
Need & Justification National Policy framework Demand Analysis to identify gaps Existing facilities /services Examination of Alternatives- physical & financial Duplication/overlapping to be avoided 13
Scope & Design Scope of scheme is defined Identification of target area/population/beneficiaries. Selection criteria of target groups/area etc. Physical parameters/components to be described Phasing of targets matching with financial outlay Delivery mechanism of goods/services Technical aspects machinery, equipment 14
Implementation & Monitoring Implementing Agency to be identified Capability of Implementing Agency Implementation structure Implementation Schedule- activity-wise Manpower- Requirement, type, new creation etc. Monitoring Mechanism QPR Nodal Officer- Overall responsibility of monitoring Provision for concurrent evaluation Management information system (MIS) 15
Plan Provision and Funding It should be included in the FYP/AP Phasing of expenditure- matching with physical targets Adequate Plan Provision /funding arrangement Sources of funding- GBS, IEBR, Loans etc. Funding Modalities- Sharing, Releases, Funds utilization Certificates, audits etc. 16
Cost Estimates Total cost of the scheme irrespective of sources Item-wise break-up recurring & non-recurring costs Basis of estimates- quotations, market price etc. Reference date /price level of estimates (< 6 month) Estimates on constant price level Quantities, rates to be used to arrive at estimates. Financial Assistance Norms/pattern 17
Benefit Cost Analysis Whether benefits are quantifiable in monetary term? If so, costs and benefits should be quantified & Valued in Financial and economic terms. Cash flows in financial & economic terms should be prepared. Financial & Economic Internal Rate of Return to be calculated to establish viability as per Govt norms. Net Present Value be calculated at prescribed discount rate- if it is positive, project is viable. If benefits are not quantifiable in monetary term, tangible and intangible benefits should be quantified & indicated along with sustainability. 18
Environmental Impacts Environmental Impact Assessment Quantification and valuation of environmental impacts Environment protection /restoration measures Rehabilitation & Resettlement Plan Cost associated with environment & forest protection Obtaining environment and forest clearances Some External impacts Power Plant: Air pollution- health hazards to people around Irrigation Project: Siltation, soil salinization- , adverse effect on agricultural yields, farm income Industrial Plant- Waste discharge into river- loss of fish production lower income of fishermen 19
Risk & Sensitivity Analysis Probable Risk factors to be identified and indicated Risk mitigation measures suggested Sensitivity analysis to be carried out by altering inflows and outflows of the project, impact of delay, less production etc. to identify variables to which project is most sensitive. 20
Financial Viability Analysis Cash Flow Preparation Valuation of inputs and outputs at market price Valuation of imported items at market rates of foreign exchange- landed cost at site. Cash flows are to be prepared at constant prices Viability to be calculated on completion cost basis. Risk/Sensitivity Analysis. 21 21
Economic Viability Analysis Cash flow Preparation Valuation of Traded inputs and outputs at border prices (CIF/FOB). Valuation of non-traded goods and services at marginal cost of their production or at opportunity cost (net off taxes & duties, subsidies etc.) Premium of FE cost is taken (20% at present). Externalities, secondary /indirect effects are identified and monetized. System and sunk costs are accounted for. 22 22
Criteria for Investment Decision Project type FIRR EIRR Normal Projects >12 % >12 % Railway >14 % >14 % Core Sector/Strategic Importance Reasons to be detailed Reasons to be detailed Mutually Exclusive Projects Higher NPV Higher NPV 23 23
Appraisal of Social Sector Schemes In confirmity with National policy Identification of Targets/Population/Areas Convergence to avoid Duplication Examination of Alternatives through Least Cost method Inclusion of Scheme in Five year/Annual Plans with adequate outlays 24 24
Sensitivity Analysis Take care of Uncertainties Take Care of Time over-run Take Care of Profitability Take Care of Capacity Utilization Take Care of Price Fluctuations Set up relation between the underlying basic factor and NPV Estimate Range of Variation Compute the impact of Variation in each Variable on NPV 25 25
Viability Indicators for Analysis FIRR Payback Period EIRR BCR NPV UCP 26 26
Proposals for Revised Cost Estimates Appraisal Aspects of RCE Present Status of Project- Physical & Financial Plan Outlays and Funding status Cost Variance analysis Between revised cost and latest approved cost Comparison item-wise Factors attributed to cost variation: Price escalations- Indigenous and FE component Exchange rate variations Statutory duties Scope Change/additions/deletions/underestimation Other reasons 27 27
Proposals for Revised Cost Estimates Appraisal Aspects of RCE contd Analysis of Time overrun Cost overrun due to time overrun Reasons of Time overrun Variance within approved PTC and beyond Fixing responsibility for time and cost over-run by Standing Committee. Viability analysis Impact of Cost and Time overruns on Economic and Financial Viability, Cost of production & generation etc. 28 28
Standing Finance Committee (SFC) (>25 cr & <100 cr.) Secretary of Administrative Ministry/Deptt. -Chairperson Financial Advisor of Admin. Ministry -Member Joint Secretary in Charge of Admin Min. -Member Representative of the Planning Commission, Department of Expenditure and any other Ministry/Department that the Secretary/Financial Advisor may suggest can also be invited, as per requirement. 29
Expenditure Finance Committee (EFC) (For proposals costing >100 cr. & <300 crore) Secretary of Admin. Ministry/Deptt. -Chairman Secretary, Planning Commission or his repres. -Member Secretary Deptt. of Expenditure) or his repres. -Member Financial Advisor of Administrative Ministry -Member-Secretary 30
Composition of EFC (Main) (Proposal costing 300 cr. & above) Secretary, Department of Expenditure -Chairman Secretary, Planning Commission or his repres. -Member Secretary of the Administrative Ministry -Member Financial Advisor of Admin. Ministry -Member-Secretary 31
Public Investment Board (PIB) Secretary, Deptt. of Expenditure Secretary ,Planning Commission) Secretary, Min. of Statistics & Progra. Impl. Secretary, Min. of Environment & Forests) -Member Secretary of Admin. Ministry Secretary, Deptt. of Economic Affairs Joint Secretary (PF.II), Deptt. of Expenditure Secretary -Chairman -Member - Member -Member -Member -Member - 32
Cost Effectiveness Analysis of Water Supply Project (Fig: in Rs.) Discount Rate 12% Alternative A Alternative B Year 0 1- 24 25 0 1- 24 Thank You Thank You 20000 Installation Cost 90000 0 -15000 70000 0 O&M Cost 22500 Total Cost 90000 20000 -15000 70000 22500 NPV ot Total Cost 219,625 240,152 Alternative A is cost effective, hence should be selected 33 33
Captive Power Plant (1320 MW)at Adra by JVC -NTPC & Railways Financial Viability Fuel Cost O&M Int on WC 0 0 0 0 0 0 0 0 428.30 64.98 22.29 666.90 163.27 40.24 666.90 163.27 40.24 666.90 163.27 40.24 666.90 163.27 40.24 666.90 163.27 40.24 666.90 163.27 40.24 666.90 163.27 40.24 666.90 163.27 40.24 666.90 163.27 40.24 666.90 163.27 40.24 666.90 163.27 40.24 666.90 163.27 40.24 666.90 163.27 40.24 666.90 163.27 40.24 666.90 163.27 40.24 666.90 163.27 40.24 666.90 163.27 40.24 666.90 163.27 40.24 666.90 163.27 40.24 666.90 163.27 40.24 666.90 163.27 40.24 666.90 163.27 40.24 666.90 163.27 40.24 666.90 163.27 40.24 0.000 0 Figs. in crore Energy kwh Year 1 2 3 4 5 6 7 8 9 10 11 12 13 14 15 16 17 18 19 20 21 22 23 24 25 26 27 28 29 SV 10% NPV 12% Cap Cost Total Outflow Tariff Rs.) Inflow Net Flow -694.75 -1042.12 -4029.55 -1181.07 861.16 1566.77 1566.77 1566.77 1566.77 1566.77 1566.77 1566.77 1566.77 1566.77 1566.77 1566.77 1566.77 1566.77 1566.77 1566.77 1566.77 1566.77 1566.77 1566.77 1566.77 1566.77 1566.77 1566.77 1566.77 654.65 2361.153 694.75 1042.12 4029.55 1181.07 515.57 870.41 870.41 870.41 870.41 870.41 870.41 870.41 870.41 870.41 870.41 870.41 870.41 870.41 870.41 870.41 870.41 870.41 870.41 870.41 870.41 870.41 870.41 870.41 870.41 -654.65 9185.154 694.75 1042.12 4029.55 1181.07 0 0 0 0 0 0 0 0 0 0 0 0 2.29 2.71 2.71 2.71 2.71 2.71 2.71 2.71 2.71 2.71 2.71 2.71 2.71 2.71 2.71 2.71 2.71 2.71 2.71 2.71 2.71 2.71 2.71 2.71 2.71 1376.73 2437.18 2437.18 2437.18 2437.18 2437.18 2437.18 2437.18 2437.18 2437.18 2437.18 2437.18 2437.18 2437.18 2437.18 2437.18 2437.18 2437.18 2437.18 2437.18 2437.18 2437.18 2437.18 2437.18 2437.18 0.00 11546.307 0 0 0 0 0 0 0 0 0 0 0 0 0 0 0 0 0 0 0 0 0 0 0 0 0 601.19 899.33 899.33 899.33 899.33 899.33 899.33 899.33 899.33 899.33 899.33 899.33 899.33 899.33 899.33 899.33 899.33 899.33 899.33 899.33 899.33 899.33 899.33 899.33 899.33 0 -654.65 0 0 4313.499 Cost of Generation at 12% discount 2.13 FIRR 17.0% Assumptions All figures on constant price level Salvage Value of capital asset is taken at 10% of capital cost excluding land cost Energy generation at 85% PLF 34
Captive Power Plant (1320 MW)at Adra by JVC -NTPC & Railways Economic Viability Figs. in crore Year 1 2 3 4 5 6 7 8 9 10 11 12 13 14 15 16 17 18 19 20 21 22 23 24 25 26 27 28 29 SV 10% NPV 12% Cap Cost Fuel Cost O&M Int on WC Outflow Energy kwh Tariff Rs.) Inflow Net Flow 661.15 991.72 3834.66 1123.95 515.57 870.41 870.41 870.41 870.41 870.41 870.41 870.41 870.41 870.41 870.41 870.41 870.41 870.41 870.41 870.41 870.41 870.41 870.41 870.41 870.41 870.41 870.41 870.41 870.41 -654.65 8939.96 -661.15 -991.72 -3834.66 -1123.95 861.16 1566.77 1566.77 1566.77 1566.77 1566.77 1566.77 1566.77 1566.77 1566.77 1566.77 1566.77 1566.77 1566.77 1566.77 1566.77 1566.77 1566.77 1566.77 1566.77 1566.77 1566.77 1566.77 1566.77 1566.77 654.65 2606.35 661.15 991.72 3834.66 1123.95 0 0 0 0 0 0 0 0 0 0 0 0 0 0 0 0 0 0 0 0 22.29 40.24 40.24 40.24 40.24 40.24 40.24 40.24 40.24 40.24 40.24 40.24 40.24 40.24 40.24 40.24 40.24 40.24 40.24 40.24 40.24 40.24 40.24 40.24 40.24 2.29 2.71 2.71 2.71 2.71 2.71 2.71 2.71 2.71 2.71 2.71 2.71 2.71 2.71 2.71 2.71 2.71 2.71 2.71 2.71 2.71 2.71 2.71 2.71 2.71 1376.73 2437.18 2437.18 2437.18 2437.18 2437.18 2437.18 2437.18 2437.18 2437.18 2437.18 2437.18 2437.18 2437.18 2437.18 2437.18 2437.18 2437.18 2437.18 2437.18 2437.18 2437.18 2437.18 2437.18 2437.18 0.00 11546.31 0 0 0 0 0 0 0 0 0 0 0 0 0 0 0 0 0 0 0 0 0 0 0 0 0 428.30 666.90 666.90 666.90 666.90 666.90 666.90 666.90 666.90 666.90 666.90 666.90 666.90 666.90 666.90 666.90 666.90 666.90 666.90 666.90 666.90 666.90 666.90 666.90 666.90 0.000 64.98 163.27 163.27 163.27 163.27 163.27 163.27 163.27 163.27 163.27 163.27 163.27 163.27 163.27 163.27 163.27 163.27 163.27 163.27 163.27 163.27 163.27 163.27 163.27 163.27 601.19 899.33 899.33 899.33 899.33 899.33 899.33 899.33 899.33 899.33 899.33 899.33 899.33 899.33 899.33 899.33 899.33 899.33 899.33 899.33 899.33 899.33 899.33 899.33 899.33 0 0 -654.65 0 0 4313.50 Cost of Generation at 12% discount 2.07 EIRR 17.7% Assumptions All figures on constant price level Salvage Value of capital asset is taken at 10% of capital cost Capital cost net off taxes & duties considering mega project benfits Energy generation at 85% PLF 35
Thank You Thank You 36 36


")
")


")
")
")
")

at Adra by JVC -NTPC & Railways")
at Adra by JVC -NTPC & Railways")