Understanding Acceptance Sampling in Quality Engineering

Acceptance sampling is a decision-making tool used to accept or reject products based on sample inspections. It involves determining sample size and allowable defects. Attributes and variables play crucial roles in this process, ensuring representative samples are inspected randomly. Homogeneity and agreement on quality levels between consumer and supplier are essential for effective acceptance sampling plans.

Download Presentation

Please find below an Image/Link to download the presentation.
The content on the website is provided AS IS for your information and personal use only. It may not be sold, licensed, or shared on other websites without obtaining consent from the author. Download presentation by click this link. If you encounter any issues during the download, it is possible that the publisher has removed the file from their server.
E N D
Presentation Transcript
IENG 484 Quality Engineering LAB 4 ACCEPTANCE SAMPYING BY ATTRIBUTES AND VARIABLES (MINITAB) Research Assistant KehindeAdewaleAdesina
OVERVIEW Acceptance sampling is useful as a decision- making tool for accepting or rejecting products and services. With acceptance sampling, you develop a plan to determine how many PRODUCT you need to inspect (sample size) and how many DEFECTS are allowed within the sample (acceptance number). Acceptance entire lot of product should be accepted or rejected. sampling indicates whether an
OVERVIEW With attributes, usually visual characteristics of the part, you typically inspect for defects, such as stains, rips, or scratches and record the number of defects or the number of defective units. UseAttributes Acceptance Sampling to create an inspection plan that you use to accept or reject a lot of incoming material based on the number of defects or the number of defectives in a representative sample. In particular, in cases when the quality of a supplier's process is unknown, acceptance sampling may be a good option as opposed to 100% inspection.
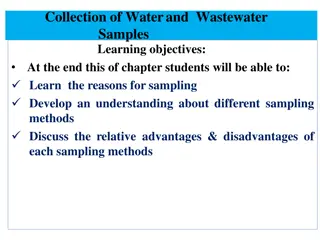
Data considerations for Acceptance Sampling The sample should be selected randomly The units to be inspected should be selected randomly and should be representative of all the items in the lot. This may require extra effort, such as numbering each item and drawing random numbers or stratifying the lot and sampling from each strata or layer. However, this process is necessary for the effectiveness of the sampling process. The data must be counts of defectives or number of defects Each item that you inspect must be classified as either acceptable or not acceptable (defective), or you must be able to count the number of defects per item.
Individual lots should be homogeneous Lots represent the entire population of units that the sample will be taken from. Lots should be homogeneous. They should be packaged and shipped in sizes that are well-managed by both the consumer and supplier, and in a way that allows easy selection of samples. Inspecting larger lots is usually more economical than inspecting a series of smaller lots.
The consumer and supplier should agree on target quality levels The consumer and supplier should agree to the highest defective rate acceptable (average quality consumer and supplier should also agree to the highest defective rate or defect rate that the consumer is willing to tolerate in an individual lot (rejectable quality level,RQL). or defect level, rate AQL). that is The The AQL describes what the sampling plan will accept, and the RQL describes what the sampling plan will reject. You want to design a sampling plan that accepts a particular lot of product at the AQL most of the time, and rejects a particular lot of product at the RQL most of the time.
Use the hypergeometric distribution for isolated lots of finite size By default, Minitab uses the binomial distribution to create sampling plans and compare sampling plans for go/no go data. To correctly use the binomial distribution, Minitab assumes that the sample comes from a large lot (the lot size is at least ten times greater than the sample size) or from a stream of lots randomly selected from an ongoing PROCESS. If the lot of products that you sample from is an isolated lot of finite size, then the exact distribution for calculating the probability of acceptance is the hypergeometric distribution. For example, you receive one special order shipment of 500 labels. NOTE The hypergeometric distribution is only available when you have go/no go (defectives) data and when you specify the lot size. Minitab uses the Poisson distribution when you count the number of defects.
Create a Sampling Plan From the drop-down, select Create a Sampling Plan. In Measurement type, select whether you count defectives or defects. Go / no go (defective): Use when you inspect units and record whether the product is defective or not. Number of defects: Use when you inspect units and record the number of defects found. In Units for quality levels, select the units of measure for your data. If you count defectives, select Percent defective,Proportion defective, or Defectives per million to represent the level of defectives in the process. If you count defects, select Defects per unit,Defects per hundred, or Defects per millionto represent the level of defects in the process. In Acceptable quality level (AQL),enter a number to represent the highest defective rate or defect rate from a supplier's process that is considered acceptable.You want to design a sampling plan that accepts a particular lot of product at the AQL most of the time.
Create a Sampling Plan In Rejectable quality level (RQL or LTPD),enter a number to represent the highest defective rate or defect rate that the consumer is willing to tolerate in an individual lot.You want to design a sampling plan that rejects a particular lot of product at the RQL most of the time. Note The RQL must be greater than the AQL. In Producer s risk (Alpha), enter a value between 0 and 1 to represent .1 represents the desired probability of accepting a lot at the AQL. In Consumer s risk (Beta), enter a value between 0 and 1 to represent . represents the desired probability of accepting a lot at the RQL. Optional: In Lot size,enter a number to represent the lot size or batch size of the entire shipment that you will accept or reject.You don't need to specify a lot size if you specify the AQL, RQL, and alpha and beta risks. However, Minitab requires the lot size to calculate the AOQ curve and the ATI curve.
Compare User Defined Sampling Plans Complete the following steps to compare multiple sampling plans to determine the effects of varying sample size or acceptance criteria. For example, compare your current sampling plans to competing plans. From the drop-down, select Compare User Defined Sampling Plans. In Measurement type, select whether you count number of defectives or number of defects. Go / no go (defective): Use when you inspect units and record whether the product is defective or not. Number of defects: Use when you inspect units and record the number of defects found. In Units for quality levels, select the units of measure for your data. If you count defectives, select Percent defective,Proportion defective, or Defectives per million to represent the level of defectives in the process.
Compare User Defined Sampling Plans If you count defects, select Defects per unit,Defects per hundred, or Defects per millionto represent the level of defects in the process. In Acceptable quality level (AQL),enter a number to represent the highest defective rate or defect rate from a supplier's process that is considered acceptable.You want to design a sampling plan that accepts a particular lot of product at the AQL most of the time. In Rejectable quality level (RQL or LTPD),enter a number to represent the highest defective rate or defect rate that the consumer is willing to tolerate in an individual lot.You want to design a sampling plan that rejects a particular lot of product at the RQL most of the time. In Sample sizes, specify the sample sizes that you want to compare in multiple sampling plans. In Acceptance numbers, specify the acceptance numbers that you want to compare in multiple sampling plans. Specify one sample size and several acceptance numbers to consider the effect of varying acceptance number.
Compare User Defined Sampling Plans Specify multiple sample sizes with only one acceptance number to consider the effect of varying sample size. Specify combinations of sample size and acceptance number to consider specific paired combinations. Use the same number of sample sizes and acceptance numbers. Optional: In Lot size,enter a number to represent the lot size or batch size of the entire shipment that you will accept or reject. You don't need to specify a lot size if you specify the AQL, RQL, and alpha and beta risks. However, Minitab requires the lot size to calculate the AOQ curve and the ATI curve.
Acceptance Sampling by Attributes Acceptance sampling by attributes is often employed in the cases where the quality characteristic of interest is not available in measurements. Most often, the identified portion of the product is usually classified as conforming or nonconforming units with the given requirements or specifications. Three types of attribute sampling plans can be conducted: (1) single sampling plans, (2) double sampling plans, and (3) sequential sampling plans.
Acceptance Sampling by Attributes Single plan A sample part of the lot is inspected and it is accepted if the number of nonconforming units found in the sample is less than or equal to the acceptance number otherwise, the lot is rejected. Follow the following steps in Minitab: Choose Stat > Quality Tools > Acceptance Sampling by Attributes. Choose Create a sampling plan. In Measurement type, choose Go / no go (defective). In Units for quality levels, choose Percent defective. In Acceptable quality level (AQL), enter the value. In Rejectable quality level (RQL or LTPD), enter the value. In Producer's risk (Alpha), enter the value In Consumer's risk (Beta), enter the value. In Lot size, enter the size. Click OK.
Example 1 A company is sourcing for the transistors, resistors, integrated circuits, and other components wh ch are needed for obta n ng the r f nal products. The company would order these component in batches of 1000 from their accred ted supplier. Assuming capacitor is to be ordered and the agreed figures for a batch of capacitor are: 1% the acceptable quality level (AQL), 8% rejectable quality level (RQL), producer's risk set at 5%, and the consumer's risk level of 10%. You as a manager for this large consumer electronics firm, you're also responsible for making sure your vendors are supplying high- quality products, and rejecting any batches that don't meet your standards. Use acceptance sampling by attributes to make a data-driven decision to either accept or reject the entire lot (Create a plan for acceptance samplying by attributes).
If for 65 items randomly selected and inspected from each lot of 1,000 capacitors, more than 2 defectives items is found, then the entire lot should be rejected. Otherwise, if fewer than 2 defective items is found, then the entire lot is accepted. The interpretation is that, from the plots of Operating Characteristic Curve show the probability of accepting lots at various incoming quality levels. Here, the probability of acceptance at the agrred AQL (1%) is 0.972, and the probability of rejecting is 0.028. This implies that your company has agreed with the supplier that lots of 1% defective would be accepted thereby giving an approximately 95% confidence of the time to protect the producer.
This implies that your company has agreed with the supplier that lots of 1% defective would be accepted thereby giving an approximately 95% confidence of the time to protect the producer. The probability of accepting a batch of capacitors at the RQL (8%) is 0.099 and the probability of rejecting is 0.901. The consumer and supplier agreed that lots of 8% defective would be rejected most of the time to confidently protect the consumer at approximately 90%.
Example 2 As a sales representative, your company is about to purchases pens from a producer. A shipment has a lot size of 5000 pens. What sampling plan would you advice your company to implement so that the entire lot of pens is either accepted or rejected, given that your company and the producer have agreed that the AQL for the sampling plan is 1.5% and that the RQL is 10%. Take producer s and customers s risks to be 5% and 10% resspectively. Acceptance Sampling by Attributes Acceptable Quality Level (AQL) 1.5 Producer's Risk (Alpha) 0.05 Rejectable Quality Level (RQL or LTPD) 10 Consumer's Risk (Beta) 0.1
Generated Plan(s) Sample Size 52 Acceptance Number 2 Accept lot if defective items in 52 sampled <= 2; Otherwise reject. Percent Probability Probability Defective Accepting Rejecting AOQ ATI 1.5 0.957 0.043 1.420 266.2 10.0 0.097 0.903 0.956 4521.9 Average outgoing quality limit (AOQL) = 2.603 at 4.300 percent defective.
For each lot of 5000 pens, the sales representative should randomly select and inspect 52 pens. If more than 2 defectives pens are found, the sales representative rejects the entire lot. For 2 or less defective pens, the sales representative accepts the entire lot. In this case, the probability of acceptance at the AQL (1.5%) is 0.957 and the probability of rejecting is 0.043. The sales representative and vendor agreed that lots of 1.5% defective would be accepted approximately 95% of the time to protect the producer. The probability of accepting at the RQL (10%) is 0.097 and the probability of rejecting is 0.903. The sales representative and vendor agreed that lots of 10% defective would be rejected most of the time to protect the consumer.
When entire lots are rejected, they are usually subjected to 100% inspection, with defective items replaced or reworked. This type of inspection is called rectifying inspection. The following parameters can be employed to analyze and understand the impact of 100% inspection and rework: The average outgoing quality (AOQ) represents the average quality of the lot after the additional inspection and rework. The AOQ level is 1.4% at the AQL and 1.0% at the RQL. The average outgoing quality limit (AOQL) = 2.603 at 4.300 percent defective and represents the worst case outgoing quality level. The average total inspection (ATI) represents the average number of inspected items after the additional inspection and rework. The ATI per lot represents the average number of pens inspected at a particular quality level and the probability of acceptance. For the quality level of 1.5% defective, the average total number of pens inspected per lot is 266.2. For the quality level of 10% defective, the average total number of pens inspected per lot is 4521.9.
Generated Plan(s) Sample Size 65 Acceptance Number 2 Accept lot if defective items in 65 sampled <= 2; Otherwise reject. Percent Probability Probability Defective Accepting Rejecting 1 0.972 0.028 8 0.099 0.901
Example 3 Suppose your company wish to have a single sampling plan that will not accept, more than 10% most of the times, material that is 8% defective or worse and have at least 95% of chance to accept a delivered lot with 1% or less nonconforming. Find sample size, n, and acceptance level, c using Minitab. Solution AQL = p1 = 1%, Producer's risk, = 100% - 95% = 5% , RQL = p2 = 8%, Consumer's risk, = 10% Acceptable Quality Level (AQL) 1 Producer's Risk (Alpha) 0.05 Rejectable Quality Level (RQL or LTPD) 8 Consumer's Risk (Beta) 0.1
Example 4 Design a samplying plan for which AQL is 2%, LTPD is 5%, and the producer;s and consumer s risks are both 5%. Acceptance Sampling by Attributes Measurement type: Go/no go Lot quality in percent defective Use binomial distribution to calculate probability of acceptance Acceptable Quality Level (AQL) 2 Producer's Risk (Alpha) 0.05 Rejectable Quality Level (RQL or LTPD) 5 Consumer's Risk (Beta) 0.05
Generated Plan(s) Sample Size 386 Acceptance Number 12 Accept lot if defective items in 386 sampled <= 12; Otherwise reject. Percent Probability Probability Defective Accepting Rejecting 2 0.951 0.049 5 0.049 0.951
Multiple plans Example of comparing attributes acceptance sampling plans Choose Stat > Quality Tools > Acceptance Sampling by Attributes. From the drop-down list, select Compare User Defined Sampling Plans. In Measurement type, select Go / no go (defective). In Units for quality levels, select Percent defective. In Acceptable quality level (AQL), enter the value. In Rejectable quality level (RQL or LTPD), enter the value. In Sample sizes, enter the size. In Acceptance numbers, enter the number. In Lot size, enter lot size. Click OK.
Multiple plans Example 6: From example 2, suppose your company has already adopted a single sampling plan that should inspect 52 pens from each lot and to accept the shipment if the number of defective pens is 2 or less is found, at AQL of 1.5% and the RQL of 10%. However, you as a sales representative is aware of a prevalent sampling plan for the same product at the same agreed terms. Carefully conduct a caparison sampling that if your sales manager wants to evaluate the risk associated with reducing the number of pens in the sample to 25 pens and reducing the acceptance number to 1.
Acceptable Quality Level (AQL) 1.5 Rejectable Quality Level (RQL or LTPD) 10 Compare User Defined Plan(s) Sample Acceptance Percent Probability Probability Size(n) Number(c) Defective Accepting Rejecting AOQ ATI 52 2 1.5 0.957 0.043 1.420 266.2 52 2 10.0 0.097 0.903 0.956 4521.9 25 1 1.5 0.946 0.054 1.412 292.4 25 1 10.0 0.271 0.729 2.698 3650.8 Sample Acceptance At Percent Size(n) Number(c) AOQL Defective 52 2 2.603 4.300 25 1 3.303 6.250 Accept lot if defective items in n sampled <= c; Otherwise reject.
The manager compares the graphs from the different sampling plans and realizes that the two sample plans are fairly similar when the incoming quality is near 1.5% defective, but are fairly different when the incoming quality is near 10% defective. At the AQL (1.5%), the probability of acceptance changes by a very small amount (0.957 0.946), and the AOQ and the ATI differences are also minimal. At the RQL (10%), the probability of acceptance changes by a much larger amount (0.271 0.097), and the AOQ and the ATI differences are also much larger. The manager decides that it is easy and inexpensive to sample pens, and does not want to risk the overall poorer average outgoing quality or the overall higher number of pens sampled, due to rectifying inspection, when the incoming quality is poor.
Acceptance Sampling by Variables Acceptance sampling by variables is employed when the quality characteristic measured in a continuous scale following a certain type of statistical distribution most often when it follows a normal distribution. Using the sample measurements of mean and standard deviation, acceptance samplying can be conducted using the sample s variables. The two major types of variable sampling plans are: ( i) variable sampling plans for lot average quality and (ii) variable sampling plans for lot percent nonconforming. Variable Sampling Plans for Lot Fraction Nonconforming When the sampling plans requires the measurement of the lot or process fraction nonconforming while the quality characteristic is a variable, then with either a lower specification limit (LSL), an upper specification limit (USL), or both, that define the acceptable values of the parameter, acceptance samplying can be conducted for the lot fraction nonconforming using Minitab. If a lower specification limit is given, a standard normal variable: ? ??? ????= ?
The standard normal variable at the upper specification limit: ????=??? ? To determine whether to accept or reject a lot, the standard normal variable ZLSL or ZUSL is estimated as the case may be and compared to a critical value k obtained from the Minitab solution. If ZLSL or ZUSL greater than or equal to k, the lot is accepted; otherwise, it is rejected. ?
Example 7:A company wants to have a variable sampling plan for polyester material which has a lower specification limit of 90 psi. The plan shall not accept, more than 10% of the time, a lot with a fraction nonconforming that is 8% or more. In the mean time, it would like to have at least 95% of chance to accept a submitted lot with a fraction nonconforming of 1% or less. Assume, that the historical standard deviation of this polyester material is given as 20 psi, with mean value of 115 psi, find the sample size n and the critical value k and advice on how the campany should accept or reject the lot. Suppose your are to compare the sample plan obtained with a number of inspected items of 35 and 55, comment of the most appropriate plan to be adopted by the company.
Acceptance Sampling by Variables - Create/Compare Lot quality in defectives per million Lower Specification Limit (LSL) 90 Historical Standard Deviation 20 Acceptable Quality Level (AQL) 1 Producer's Risk (Alpha) 0.05 Rejectable Quality Level (RQL or LTPD) 8 Consumer's Risk (Beta) 0.1 Generated Plan(s) Sample Size 45 Critical Distance (k Value) 4.50686 Z.LSL = (mean - lower spec)/historical standard deviation Accept lot if Z.LSL >= k; otherwise reject. Defectives Probability Probability Per Million Accepting Rejecting 1 0.951 0.049 8 0.098 0.902
A variable sampling plan for lot fraction nonconforming is obtained with a critical value of 4.50686and a sample size of 45. This implies that a random sample of 45 units should be selected from the batch and have its sample average tensile strength calculated. The standard normal variable, ZLSL, is next calculated and is compared to k. Accept the lot if ZLSL is greater than k; otherwise, reject it. To accept/reject, ??? ?? ?? ????= = ?.?? Since ZLSL of 1.25 is less the the critical distance (k value) of 4.50686, the lot should be rejected.
Compare User Defined Plan(s) Sample Critical Defectives Probability Probability Size(n) Distance(k) Per Million Accepting Rejecting 35 4.50686 1 0.928 0.072 35 4.50686 8 0.127 0.873 45 4.50686 1 0.951 0.049 45 4.50686 8 0.098 0.902 55 4.50686 1 0.966 0.034 55 4.50686 8 0.077 0.923 Z.LSL = (mean - lower spec)/historical standard deviation Accept lot if Z.LSL >= k; otherwise reject.
THANKS For further information : kehinde.adesina@cc.emu.edu.tr


")
")


")


")
")


 1.5")
 1.5")


")
")