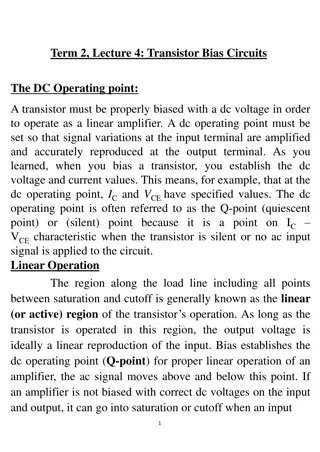
Understanding Bias in Sampling and Surveys
This lesson explores how undercoverage and nonresponse can introduce bias in sample surveys, affecting the reliability of the findings. Through examples like malnourished dogs and alumni income surveys, the text highlights how sampling methods can lead to skewed results. Understanding these biases is crucial in conducting accurate statistical analysis.

Download Presentation

Please find below an Image/Link to download the presentation.
The content on the website is provided AS IS for your information and personal use only. It may not be sold, licensed, or shared on other websites without obtaining consent from the author. Download presentation by click this link. If you encounter any issues during the download, it is possible that the publisher has removed the file from their server.
E N D
Presentation Transcript
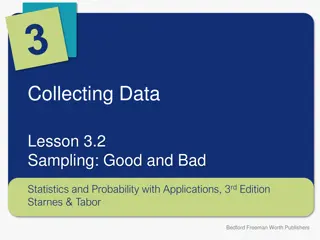
Collecting Data Lesson 3.5 Sampling and Surveys Statistics and Probability with Applications, 3rdEdition Starnes & Tabor Bedford Freeman Worth Publishers
Sampling and Surveys Learning Targets After this lesson, you should be able to: Explain how undercoverage can lead to bias. Explain how nonresponse can lead to bias. Explain how other aspects of a sample survey can lead to bias. Statistics and Probability with Applications, 3rdEdition 2 2
Sampling and Surveys Even when samples are selected at random, there are other potential sources of bias in a survey. Undercoverage Undercoverage occurs when some members of the population are less likely to be chosen or cannot be chosen for the sample. Undercoverage leads to bias when the undercovered individuals differ from the population in ways that affect their responses. Statistics and Probability with Applications, 3rdEdition 3 3
Aint Ain t it a doggone shame? it a doggone shame? Undercoverage Undercoverage PROBLEM: What proportion of dogs are malnourished? A veterinarian examines the records of a random sample of 100 dogs enrolled in her practice and finds that 2% of these dogs are malnourished. Describe how undercoverage might lead to bias in this study. Explain the likely direction of the bias. Dogs enrolled in a veterinarian practice are likely to have owners who take better care of them than other owners, on average. Because the sample includes only dogs enrolled in a veterinary practice, the estimate of the percentage of malnourished dogs is likely to be too low. Statistics and Probability with Applications, 3rd Edition 4 4
Sampling and Surveys Even if every member of the population is equally likely to be selected for a sample, not all members of the population are equally likely to provide a response. Nonresponse Nonresponse occurs when an individual chosen for the sample can t be contacted or refuses to participate. Nonresponse leads to bias when the individuals who can t be contacted or refuse to participate would respond differently from those who do participate. Statistics and Probability with Applications, 3rd Edition 5 5
How much do you make? How much do you make? Nonresponse Nonresponse PROBLEM: At a recent alumni reunion for a large university, a survey about the annual income was given to the 2431 alums attending the reunion. Of the 42 alums who responded, the mean income was ? = $132,473. Describe how nonresponse might lead to bias in this study. Explain the likely direction of the bias. People who don t earn much might be embarrassed and choose not to reply to the survey. On the other hand, people who have high incomes are probably happy to share their financial success. This means that the estimate from the sample is likely to be larger than the mean annual income for all 2,431 alums attending the reunion. Statistics and Probability with Applications, 3rd Edition 6 6
Sampling and Surveys Even when a researcher can avoid undercoverage and nonresponse, it is still possible for bias to affect the results. Characteristics of the interviewer, wording of the question, respondents being untruthful, lack of anonymity, and many other factors can lead to response bias. Response Bias Response bias occurs when there is a consistent pattern of inaccurate responses to a survey question. Statistics and Probability with Applications, 3rd Edition 7 7
Do the police speed, too? Do the police speed, too? Response bias Response bias PROBLEM: What percent police officers break the speed limit more than 3 times last week on their drive to work? A police officer surveys a random sample of 100 attendees at a police officers convention and finds that 7% of the respondents said yes. Explain how response bias may affect this survey. Explain the likely direction of the bias. When asked in person, many officers might be embarrassed to admit that they break the laws they are sworn to uphold. The sample proportion is likely less than the true proportion of all officers who break the speed limit more than 3 times last week on their drive to work. Statistics and Probability with Applications, 3rd Edition 8 8
Sampling and Surveys Completely avoiding bias when conducting a survey is likely impossible. But there are ways that thoughtful researchers can keep bias to a minimum. Selecting a random sample is a good start. Taking steps to avoid undercoverage, nonresponse, and response bias can make surveys even better. Finally, it is a good idea to test out the survey on a small group of people before administering it to the entire sample. This type of pilot study can help discover any problems with question wording or other unforeseen issues. Statistics and Probability with Applications, 3rd Edition 9 9
LESSON APP 3.5 Who did you say is calling? Literary Digest? One of the most famous flops in survey history occurred in 1936. To predict the outcome of the presidential election between Republican Alf Landon and Democrat Franklin D. Roosevelt, the magazine Literary Digest sent over 10,000,000 ballots to its subscribers. They also sent ballots to registered owners of an automobile or telephone. About 2,400,000 of the ballots were returned, with a large majority (57%) favoring Landon. The election turned out to be a landslide, but for Roosevelt (61%) instead of Landon. 1. 2. 3. Explain how undercoverage might have led to bias in this survey. Explain how nonresponse might have led to bias in this survey. If the magazine followed up with people who didn t return their ballots and was able to obtain responses, would this eliminate the bias described in part (a) or (b)? Explain. Statistics and Probability with Applications, 3rd Edition 10 10
LESSON APP 3.5 Who did you say is calling? Literary Digest? 1. Explain how undercoverage might have led to bias in this survey. 2. Explain how nonresponse might have led to bias in this survey. 3. If the magazine followed up with people who didn t return their ballots and was able to obtain responses, would this eliminate the bias described in part (a) or (b)? Explain. Statistics and Probability with Applications, 3rd Edition 11 11
Sampling and Surveys Learning Targets After this lesson, you should be able to: Explain how undercoverage can lead to bias. Explain how nonresponse can lead to bias. Explain how other aspects of a sample survey can lead to bias. Statistics and Probability with Applications, 3rd Edition 12 12