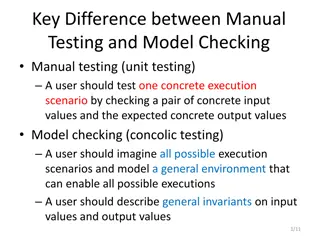
Jar Testing: A Comprehensive Overview of Procedures and Applications
Explore the world of Jar Testing through a detailed presentation encompassing topics like Jar Testing Application, Equipment/Tools, Protocol, Filterability Analysis, and Case Studies. Understand the importance of timely and efficient testing, optimal coagulant dosage, and building confidence in your data. Discover the extensive Jar Test applications and research assistance provided across various treatment plants. Delve into the equipment needed for Jar Testing, including turbidity instruments, syringes, filter holders, and membrane filters.

Download Presentation

Please find below an Image/Link to download the presentation.
The content on the website is provided AS IS for your information and personal use only. It may not be sold, licensed, or shared on other websites without obtaining consent from the author. Download presentation by click this link. If you encounter any issues during the download, it is possible that the publisher has removed the file from their server.
E N D
Presentation Transcript
JAR TESTING MADE EASY CA-NV AWWA FALL CONFERENCE by Guy Schott, P.E. October 29, 2020
Presentation Overview Topics 1. Jar Testing Application, Research & Assistance 2. Equipment/Tools 3. Jar Test Protocol 4. Filterability & UVT/UVA analysis Case Studies 1. Coagulant Overdosing 2. Coagulant Under Dosing 3. Coagulant Optimization (point of diminishing return) 4. With/without Acid 5. With/without Pre-Oxidation (Ozone/NaOCl/KMnO4) 6. Pre-cursor Reduction Optimization (TTHM/HAA5)
Jar Testing Whats Important 1. Timely & Efficient - completed within 1 hour (prep, testing and analysis) 2. One set of procedures, methods and analysis Procedures: The order of steps to be completed Method: The technique for each procedural step Analysis: Turbidity and UVT/UVA 3. Coagulant(s) and dose that provides optimum Filterability (NTU, floc strength) Indirect dissolved organic carbon reduction (UVT/UVA) Settleability (NTU) 4. Confidence in your jar testing data that is transferable to plant operations
Jar Test Application/Research/Assistance (2018-2020) 14 Counties (California) 40 Public Surface Water Treatment Plants 11 of those Plants Visited Multiple Times Plant Size from 30 gpm 50 MGD >1,800 Jars Training
Applied Jar Test Procedures, Methods & Analysis for Various Treatment Plants (20) Conventional Treatment Plants with Media Filtration & Membrane Filtration (3) Direct Filtration Plants with Media Filtration & Membrane Filtration (2) Dissolved Air Flotation (DAF) with Media Filtration & Membrane Filtration (8) Alternative Technologies Roughing Contact Clarifier/Media Filtration & Inline Filtration (2) Actiflo (ballast sand) with Media Filtration (5) Trident & Roberts Absorption/Contact Media Filtration
Jar Test Filterability Test Equipment Turbidity Instrument Syringe w/Luer-Lock Tip, 30 cc (part#: 2225800, by Hach) Swinnex Filter Holder, 25 mm (part#: SX0002500) Isopore Membrane Filter, 1.2 um absolute pore size, = 25 mm , thickness: 24 um, hydrophilic polycarbonate membrane (part #: RTTP02500) Go to Sigma-Aldrich for laboratory supplies http://www.sigmaaldrich.com/united-states.html
UVT/UVA UV transmittance (UVT) is a measurement of the amount of ultraviolet light (commonly at 254 nm due to its germicidal effect) that passes through a water sample compared to the amount of light that passes through a pure water sample. The measurement is expressed as a percentage, % UVT. %UVT = 10(-UVA) x 100% UV absorbance (UVA) is calculated as a relative measure of the amount of light absorbed by a water sample compared with the amount of light absorbed by a pure water sample. UVA = -log(%UVT/100)
Indirect DOC Reduction (Source to Treated) 0.110 0.100 0.090 0.080 UVA/cm 0.070 0.060 0.050 0.040 0.030 0.020 0% 10% 20% 30% 40% 50% 60% 70% 80% UVA Percent Reduction
Seasonal Shift in Primary Source Water Algal Bloom (Lyngbya) Algal Bloom (Microcystin) Rain Event Uneventful
Laboratory Charge Analyzer Used to determine coagulant demand of a source water entering the treatment plant. 1 Liter of source water Automatic titrates coagulant to charge neutralization Tool used to narrow down optimum coagulant dose range for jar testing
Plant ID LCA Best Jar Coagulant mg/L 35 32.5 38 28 35 16 29 23 35 12 1.5 9.0 105 36 9.5 Plant ID LCA Best Jar Coagulants mg/L 90 54 30 26/2.6 23 76/5 90 14 23 40/4 30 14.5 34 190 8.0 Coagulant mg/L 27 31 38 23.2 31.9 15 29 19 35 12.3 1.6 8.7 101 36 9.45 Coagulants mg/L 90 54 31.8 28 19 76/5 90 14 18.8 38.4/4 25 14.5 32 192 7.5 LP SW NMW GS CW CF LP RV HM SFG PV KsC SH AC SC41 MK BHP KCW HMW CLO VH HV CW KC GSD GTD FSP HH COC MID
Instruments used to Assist with Jar Testing Turbidity Instrument Portable UV254 Analyzer Surrogate measurement for TOC/DOC https://chemtrac.com/portable-uv254-monitor-uvp/ https://realtechwater.com/products/p-series/ Laboratory Charge Analyzer (LCA) Coagulation optimization tool Https://chemtrac.com/laboratory-charge-analyzer/
Jar Testing Procedures, 1-Liters Round Jars 1. Flash Mix 200 RPM (20-30 sec) Pipette coagulant into each jar. 2. Flocculation 20-30 RPM (5 min) Floc for 5 minutes. 3. Filterability & Filtrate %UVT/UVA Analysis Sample at end of flocculation period for plants without settling. Wait 5 minutes for plants with settling. 4. Settleability Analysis After 25 minutes of settling, measure settled water turbidity. Lift paddles and lock.
Jar Testing for a Four-Jar Mixer 35 minutes to complete jar testing and analysis 5 minutes of jar testing (20-30 sec, 200 RPM; 5 min, 20-30 RPM) 5-minute wait before 25 mL of water is drawn from each jar 20 minutes Analysis: Filtrate Turbidity Filtrate %UVT/UVA %UVA Reduction (source to treated, calc.) 4 minutes: Settled Water pulled from each jar and turbidity measurements
Jars 1-4: End of 5-minute flocculation (30 RPM) duration (Source 1).
Jars 1-4: After 5 min of settling, 25 mL is syringed for filterability and %UVT/UVA.
18 mg/L coagulant Filtrate 0.11 NTU UVT: 92.5% UVA: 0.034/cm UVA Reduction 57.5% Settled: 0.85 NTU 23 mg/L coagulant Filtrate 0.07 NTU UVT: 92.4% UVA: 0.034/cm UVA Reduction 57.5% Settled: 0.65 NTU 28 mg/L coagulant Filtrate 0.05 NTU UVT: 93.2% UVA: 0.031/cm UVA Reduction 61.3% Settled: 0.8 NTU 33 mg/L coagulant Filtrate 0.09 NTU UVT: 93.1% UVA: 0.031/cm UVA Reduction 61.3% Settled: 1.0 NTU Jars 1-4: After 25-minutes of settling, settled water turbidity is taken (Source 1).
Filterability and UVT/UVA Analysis 1. Flocculated water is pushed through a 1.2 um absolute Isopore membrane (drip-rate) and measured for turbidity. 2. Water from cuvette is transferred to UVT/UVA cuvette for measurements.
Settleability Test
Why 20-30 sec Flash Mix (200 RPM) Jar Test - Flash and Flocculation RPM & Durations Why 5 minutes Floc Mix (20-30 RPM)
Flash Mix Duration (0 60 seconds) Coag mg/L Filtrate NTU Filtrate %UVT Filtrate UVA/cm Settled NTU 25 min Plant ID 200 RPM Flash, sec 0 30 0 15 30 60 0 60 0 60 30 RPM Floc mix min 5 5 5 5 5 5 5 5 5 5 54 54 18 18 18 18 1.5 1.5 8.0 8.0 0.09 0.08 0.06 0.06 0.07 0.07 0.11 0.08 0.13 0.10 95.4 95.8 89.4 89.2 89.3 89.2 97.8 97.2 96.8 96.6 0.020 0.019 0.049 0.050 0.049 0.050 0.010 0.012 0.014 0.015 0.90 0.53 0.28 0.34 0.36 0.26 1.8 1.4 7.0 4.8 SW SW CW CW CW CW GTD GTD SC41 SC41
Flash vs. No Flash Mixing, variable Floc Duration (1) Jar # 200 RPM Flash sec 30 30 30 30 0 0 0 0 30 RPM Floc mix min 3 5 10 15 3 5 10 15 Chem E mg/L Chem F mg/L Filtrate NTU Filtrate %UVT Filtrate UVA/cm Settle NTU 25 min 0.024 0.025 0.024 37.7 37.7 37.7 37.7 37.7 37.7 37.7 37.7 36.6 36.6 36.6 36.6 36.6 36.6 36.6 36.6 0.06 0.07 0.06 0.09 0.07 0.12 0.15 0.10 94.5 94.3 94.4 94.3 94.3 94.0 93.9 94.0 1.87 1.07 0.82 0.39 2.51 1.53 0.75 0.43 1 2 3 4 5 6 7 8 0.025 0.025 0.026 0.027 0.026
Flash vs. No Flash Mixing, variable Floc Duration Jar # 200 RPM Flash sec 60 60 60 60 0 0 0 0 30 RPM Floc mix min 5 10 20 40 5 10 20 40 Chem C mg/L Chem D mg/L Filtrate NTU Filtrate %UVT Filtrate UVA/cm Settle NTU 25 min 23 23 23 23 23 23 23 23 1.15 1.15 1.15 1.15 1.15 1.15 1.15 1.15 0.08 0.07 0.07 0.07 0.07 0.07 0.08 0.06 0.023 0.025 0.023 0.023 0.025 0.024 0.024 0.024 0.48 0.39 0.30 0.36 0.43 0.30 0.22 0.15 1 2 3 4 5 6 7 8 94.8 94.5 94.9 94.9 94.4 94.6 94.6 94.7
Variable Flocculation Duration (3 40 minutes) Floc Mix min Coag/ Aid mg/L Filtrate NTU Filtrate %UVT Filtrate UVA/cm Settled NTU 25 min Plant ID 200 RPM Flash, sec 30 30 30 30 30 30 30 60 60 60 60 RPM Floc Speed 0.024 0.025 0.024 0.025 0.038 0.037 0.037 0.023 0.025 0.023 0.023 30 30 30 30 30 30 30 30 30 30 30 3 5 38/37 38/37 38/37 38/37 29/2.9 29/2.9 29/2.9 23 23 23 23 0.06 0.07 0.06 0.09 0.08 0.09 0.08 0.08 0.07 0.07 0.07 94.5 94.3 94.4 94.3 91.7 91.8 91.8 94.8 94.5 94.9 94.9 1.87 1.07 0.82 0.39 0.38 0.22 0.30 0.48 0.39 0.30 0.36 COC COC COC COC GS GS GS CLO CLO CLO CLO 10 15 5 10 20 5 10 20 40
Filterability (25 mL, syringed); Dose 30 mg/L; Jars 1-4, sampled at end of Floc period vs. Jars 5-8, sampled 5 minutes from end of Floc period Jar # 200 RPM Flash sec 20 20 20 20 20 20 20 20 Floc 20 RPM min 5 15 30 45 5 15 30 45 Filtrate NTU Filtrate %UVT Filtrate UVA/cm %UVA Reduction Settle NTU 10 min 0.50 0.29 0.31 0.23 0.74 0.37 0.27 0.16 Settle NTU 25 min 0.36 0.32 0.27 0.25 0.35 0.30 0.29 0.20 0.09 0.08 0.07 0.08 0.08 0.09 0.08 0.07 91.4 91.1 91.3 91.4 90.8 90.9 91.6 91.1 0.039 0.040 0.039 0.038 0.041 0.041 0.038 0.040 48.7 47.4 48.7 50.0 46.1 46.1 50.0 47.4 1 2 3 4 5 6 7 8
Jar Test Cases 1. Coagulant Overdosing 2. Coagulant Under Dosing 3. Coagulant Optimization Point of Diminishing Returns 4. With/without Acid 5. With/without Pre-Oxidation (NaOCl/Ozone/KMnO4) 6. Pre-cursor Reduction Optimization (TTHM/HAA5)
Case 1. Coagulant Overdosing Storm Event Source turbidity: 126 NTU, storm event 50% of plant off-line for filter media change out Plant settled water turbidity > 11 NTU Filter backwashing once per hour Plant filtrate turbidity: 0.27 NTU Operator overwhelmed/not enough sleep Operator doubles coagulant dose: 110 mg/L
Case 1. Jar Test Results vs Plant (coagulant overdosing, 110 mg/L) Jar # Coagulant mg/L 45 55 65 75 85 110 Filtrate NTU 0.50 0.35 0.18 0.05 0.14 0.20 Filtrate %UVT 89.3 90.7 91.6 91.7 91.4 92.6 Filtrate UVA/cm 0.049 0.042 0.038 Settled NTU 2.2 1.9 2.4 2.8 3.2 7.0 J1 J2 J3 J4 J5 J6 0.039 0.039 0.033
Case 1. Jar Test Results versus Adjusted Plant Coagulant Dose Jar Test Results Coagulant Dose: 75 mg/L Filtrate: 0.05 NTU Settled: 2.8 NTU Plant Results Coagulant Dose: 75 mg/L Filtrate: 0.05 NTU Settled: 2.0 NTU Filter Run time (increased from 1 to 6 hrs.)
Case 2. Coagulant Under dosing Source turbidity: 7.8 NTU Plant settled water turbidity ~ 1 NTU Plant filtrate turbidity: 0.09 NTU Has aeration for TTHMs reduction %TOC Reduction not being met Plant dose (Coag 1 = 3.4 mg/L, Coag 2 = 3.0 mg/L)
Case 2. Jar Test Results versus Plant (coagulant under dosing, 3.4/3 mg/L) Jar # Coag 1 mg/L Coag 2 mg/L Filtrate NTU Filtrate %UVT Filtrate UVA/cm %UVA Reduction Settle NTU 25 min 3.4 24 23 22 21 3.0 0 1.0 2.0 3.0 0.23 0.10 0.10 0.12 0.07 0.050 0.033 0.033 0.033 0.032 15.3 44.1 44.1 44.1 45.8 1.06 0.33 0.31 0.33 0.33 J1 J2 J3 J4 J5 89.1 92.6 92.6 92.5 92.8
Case 3. Jar Test Results - Coagulant Optimization Point of Diminishing Returns Jar Coagulant mg/L 18 20 22 24 26 28 32 75 Filtrate NTU 0.11 0.08 0.07 0.08 0.08 0.07 0.07 0.07 Filtrate %UVT 91.9 91.9 92.0 92.3 92.8 92.9 92.9 93.5 Filtrate UVA/cm 0.036 0.036 0.036 0.034 0.032 0.031 0.031 0.029 %UVA Reduction 32.1 32.1 32.1 35.8 39.6 41.5 41.5 45.3 Settled NTU 0.48 0.50 0.44 0.38 0.40 0.34 0.34 0.33 J1 J2 J3 J4 J5 J6 J7 J8
Case 4. Pre-Oxidation Ozone Chlorine KMnO4 Improve coagulation process Improve settleability Improve filtrate turbidity Increase %UVT or lower UVA (positive/negative effects) Longer filter runs Reduce sludge production
Case 4.1. Pre-Oxidation with & without Ozone Jar # 1 2 3 4 5 6 7 8 Ozone added No No No No Yes Yes Yes Yes Coag mg/L 35 40 45 50 18 23 28 33 Filtrate NTU 0.12 0.08 0.09 0.09 0.11 0.07 0.05 0.09 Filtrate %UVT 87.4 88.2 88.6 88.7 92.5 92.4 93.2 93.1 Filtrate UVA/cm 0.058 0.055 0.053 0.052 0.034 0.034 0.031 0.031 %UVA Reduction 36.2 39.6 41.8 42.9 62.6 62.6 65.9 65.9 Settled NTU 0.7 0.65 1.0 1.2 0.85 0.65 0.80 1.0
Case 5. Performance with/without Acid Source Water pH and Alkalinity Changes Constituents pH Alkalinity as CaCO3, mg/L 158 138 127 153 151 8.92 - 9.0 7.8 7.4 8.73 8.62 Source pH H2SO4 = 20 mg/L H2SO4 = 30 mg/L Coag = 40 mg/L Coag= 60 mg/L
Case 5. Performance with/without Acid Jar # H2SO4 mg/L Coag. mg/L Filtrate NTU Filtrate %UVT Filtrate UVA/cm %UVA Reduction Settle NTU 25 min 0.40 0.40 0.47 0.38 0 0 30 30 40 60 40 60 0.14 0.11 0.12 0.08 89.5 90.1 91.1 92.0 0.047 0.045 0.040 0.036 40.5 43.0 49.4 54.4 J1 J3 J2 J4
Case 6. Out of Compliance with TTHMs/HAA5s Jar tested source water over a 12-month period Tested 12 coagulants Compare coagulants/doses to filterability and %UVT/UVA Selected best performing coagulant Conducted side-by-side study (Treatment Trains 1 & 2) Compare Filtrate turbidity and %UVT/UVA Spike filtrate samples with 2.0 mg/L NaOCl Held for 7-days Tested TTHMs/HAA5s
Case 6. Trains 1 and 2, On-site Study *Results 1-liter filtrate samples were taken from each treatment train and spiked with 2.0 mg/L NaOCl and held for 7-days, TTHMs/HAA5s analyzed. Train # 1 Coagulant Filtrate NTU 0.06 %UVT UVA/cm %UVA Reduction 91.1 *TTHMs ug/L 43 *HAA5s ug/L 9.9 New 97.2 0.012 Coagulant Original Coagulant 0.07 90.8 0.042 68.9 110 49 2
Jar Testing Made Easy Recap Keep it Simple Measurements Evaluate Repeat Filtrate NTU Filtrate %UVT/UVA Settled NTU Evaluate results and determine next course of action Once optimum dose is found, repeat test for confirmation. Don t obsess in trying to model jar testing with plant mixing energies and contact times Goal is to mix the chemical and form a floc (fast/slow mixing) Don t rely on visual floc formation and settleability as optimum dosage
Practice Practice Practice Don t end-up sleeping with the fishes. Jar testing should be performed regularly during non-water quality events to develop and maintain the necessary skills and confidence to be able to confront real water quality changes. Initial skill and confidence building will require several hours (~100 hours) of jar testing and practice.
Contact and Links Guy Schott, P.E. State Water Resources Control Board Division of Drinking Water Santa Rosa, CA Go to Jar Test Results/Procedures for tools to download www.waterboards.ca.gov/drinking_water/programs/districts/mendocino_district.html Email: Guy Schott - Guy.Schott@waterboards.ca.gov Office Number: 707-576-2732
Case 4.2. Pre-Oxidation with/without chlorine Jar # NaOCl mg/L Coag mg/L Aid mg/L Filtrate NTU Filtrate %UVT Filtrate UVA/cm %UVA Reduction Settled NTU 25 min 0.39 0.24 0.50 0.23 0.24 0.14 0.30 0.18 0.054 0.048 0.052 0.046 0.052 0.044 0.049 0.045 0 19 19 23 23 31 31 35 35 4 4 4 4 0 0 0 0 0.06 0.04 0.05 0.04 0.06 0.05 0.05 0.04 88.4 89.6 88.7 89.9 88.8 90.3 89.3 90.2 34.1 41.5 36.6 43.9 36.6 46.3 40.2 45.1 J1 J2 J3 J4 J5 J6 J7 J8 2.0 0 2.0 0 2.0 0 2.0
NaOCl Pre-Oxidation Generally: For a given coagulant dose, there will be an increase in %UVT or decrease in UVA when NaOCl is added. It is believed that some of the DOC is converted to disinfection by-products giving a false indication of improved DOC reduction via coagulation.
Case 4.3. Pre-Oxidation with & without KMnO4 Jar # 1 2 3 4 5 6 7 8 KMnO4 Added No No No No Yes Yes Yes Yes Coag mg/L 24/2.4 26/2.6 28/2.8 30/3.0 23/2.3 25/2.5 27/2.7 29/2.8 Filtrate NTU 0.10 0.08 0.08 0.07 0.12 0.10 0.09 0.08 Filtrate %UVT 90.5 90.6 90.6 90.8 91.1 91.5 91.5 91.7 Filtrate UVA/cm 0.043 0.043 0.043 0.042 0.040 0.039 0.039 0.038 %UVA Reduction 37.7 37.7 37.7 39.1 42.0 43.5 43.5 44.9 Settled NTU 0.31 0.41 0.32 0.37 0.48 0.40 0.39 0.38
Jar Testing for 1-Liter Jars: General Procedures for Most Treatment Plants 1. Fill jars with source water prior to coagulant injection and set paddle speed at 30 rpm 2. Add chemicals (i.e., NaOCl, primary coagulant, coagulant aid) to each jar 3. Flash mix for 15-30 seconds (200 rpm) 4. Slow mix for 5 minutes (20-30 rpm) 5. Settled for 5 minutes. Syringe 25 mL from each jar taken 1-inch below surface (25 mL/12 sec rate) 6. Filtered through 1.2 um isopore membrane into cuvette drip rate, 15 mL/(50-90 sec) 7. Measure filtrate turbidity, chlorine residual and %UVT/UVA 8. Measure settled water turbidity after 25 minutes of total setting 9. Record all data


 duration")


")


")
")

")
; Dose 30 mg/L;")